

Description
Scrutoscope is a read-only profiling plugin for WordPress. It instruments every hook callback during a page request and attributes the time to its source — plugin, theme, core, mu-plugin, or drop-in — so you can see exactly what’s slow and why.
By the author of P3 (Plugin Performance Profiler). Scrutoscope is the spiritual successor, rebuilt from scratch for modern WordPress.
What It Measures
- Server Request Duration — Total wall-clock time for the PHP request
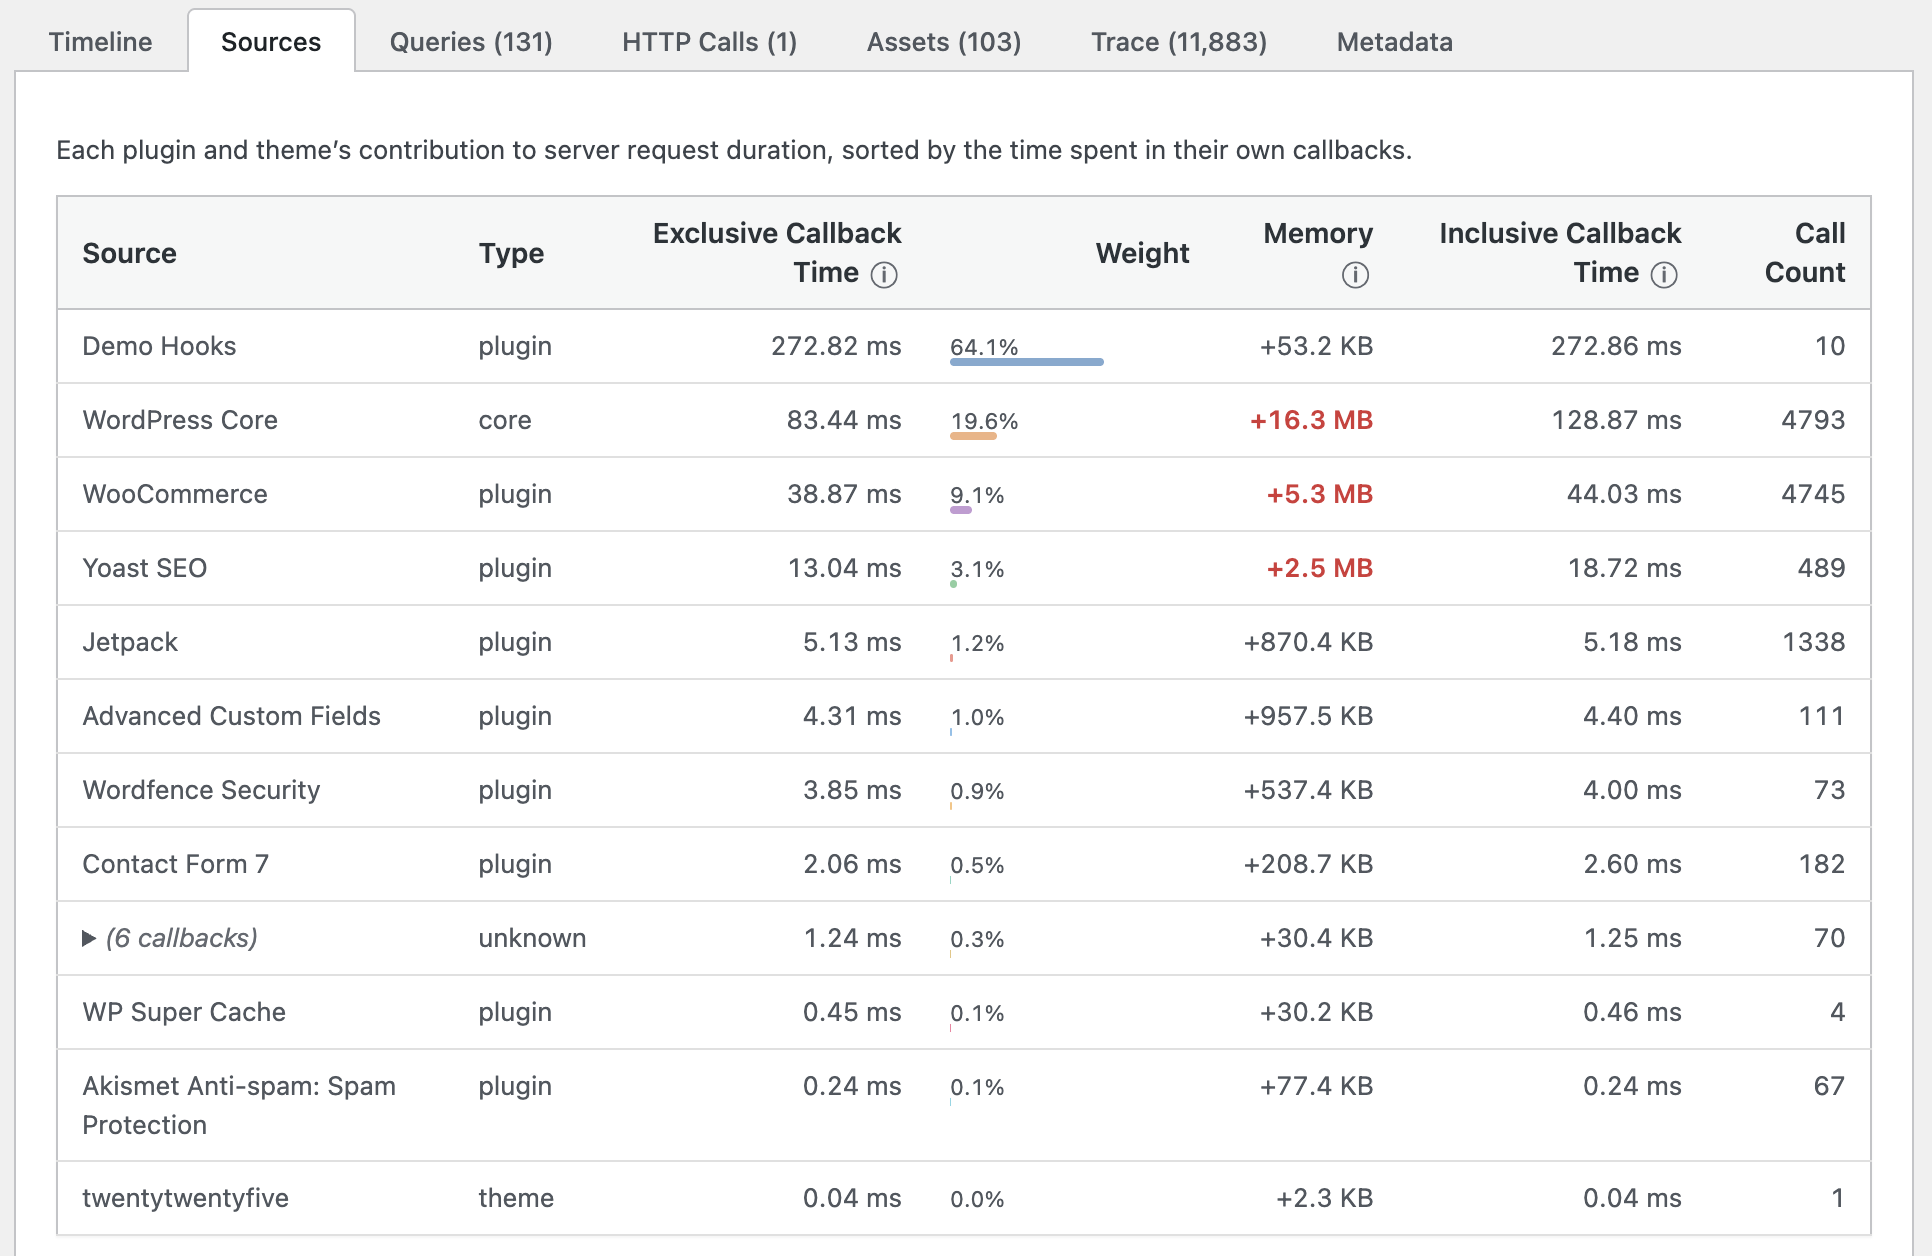
- Source Attribution — Every hook callback traced to its plugin/theme/core with exclusive and inclusive timing
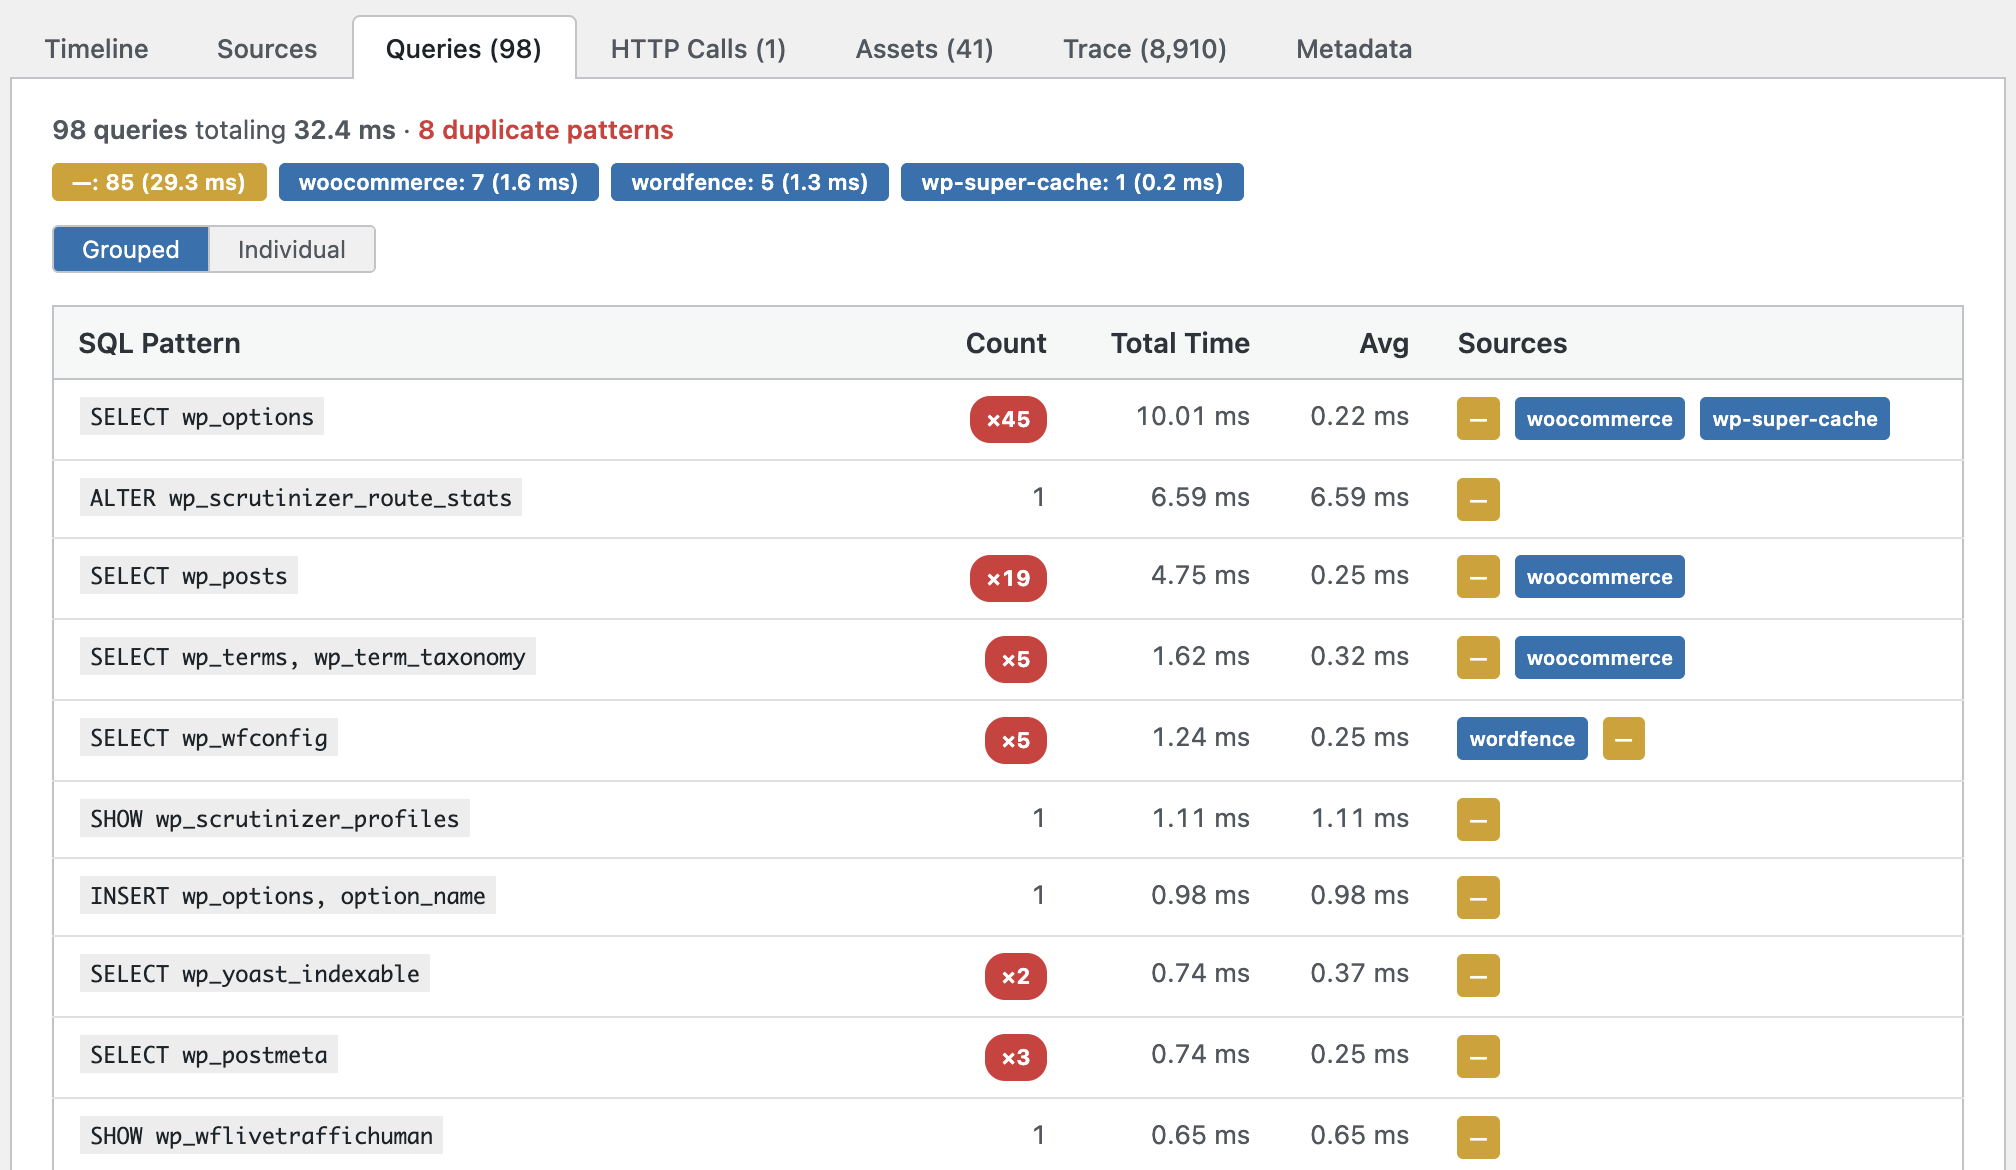
- Database Queries — Query text (sanitized), execution time, caller, and source
- HTTP Calls — External request destination host (paths and query strings are stripped), duration, response code, and whether PHP waited for the response (blocking vs. async)
- Autoloaded Options — Option names, sizes, and sources contributing to autoload bloat
- Enqueued Assets — Scripts and stylesheets with sizes and dependency chains
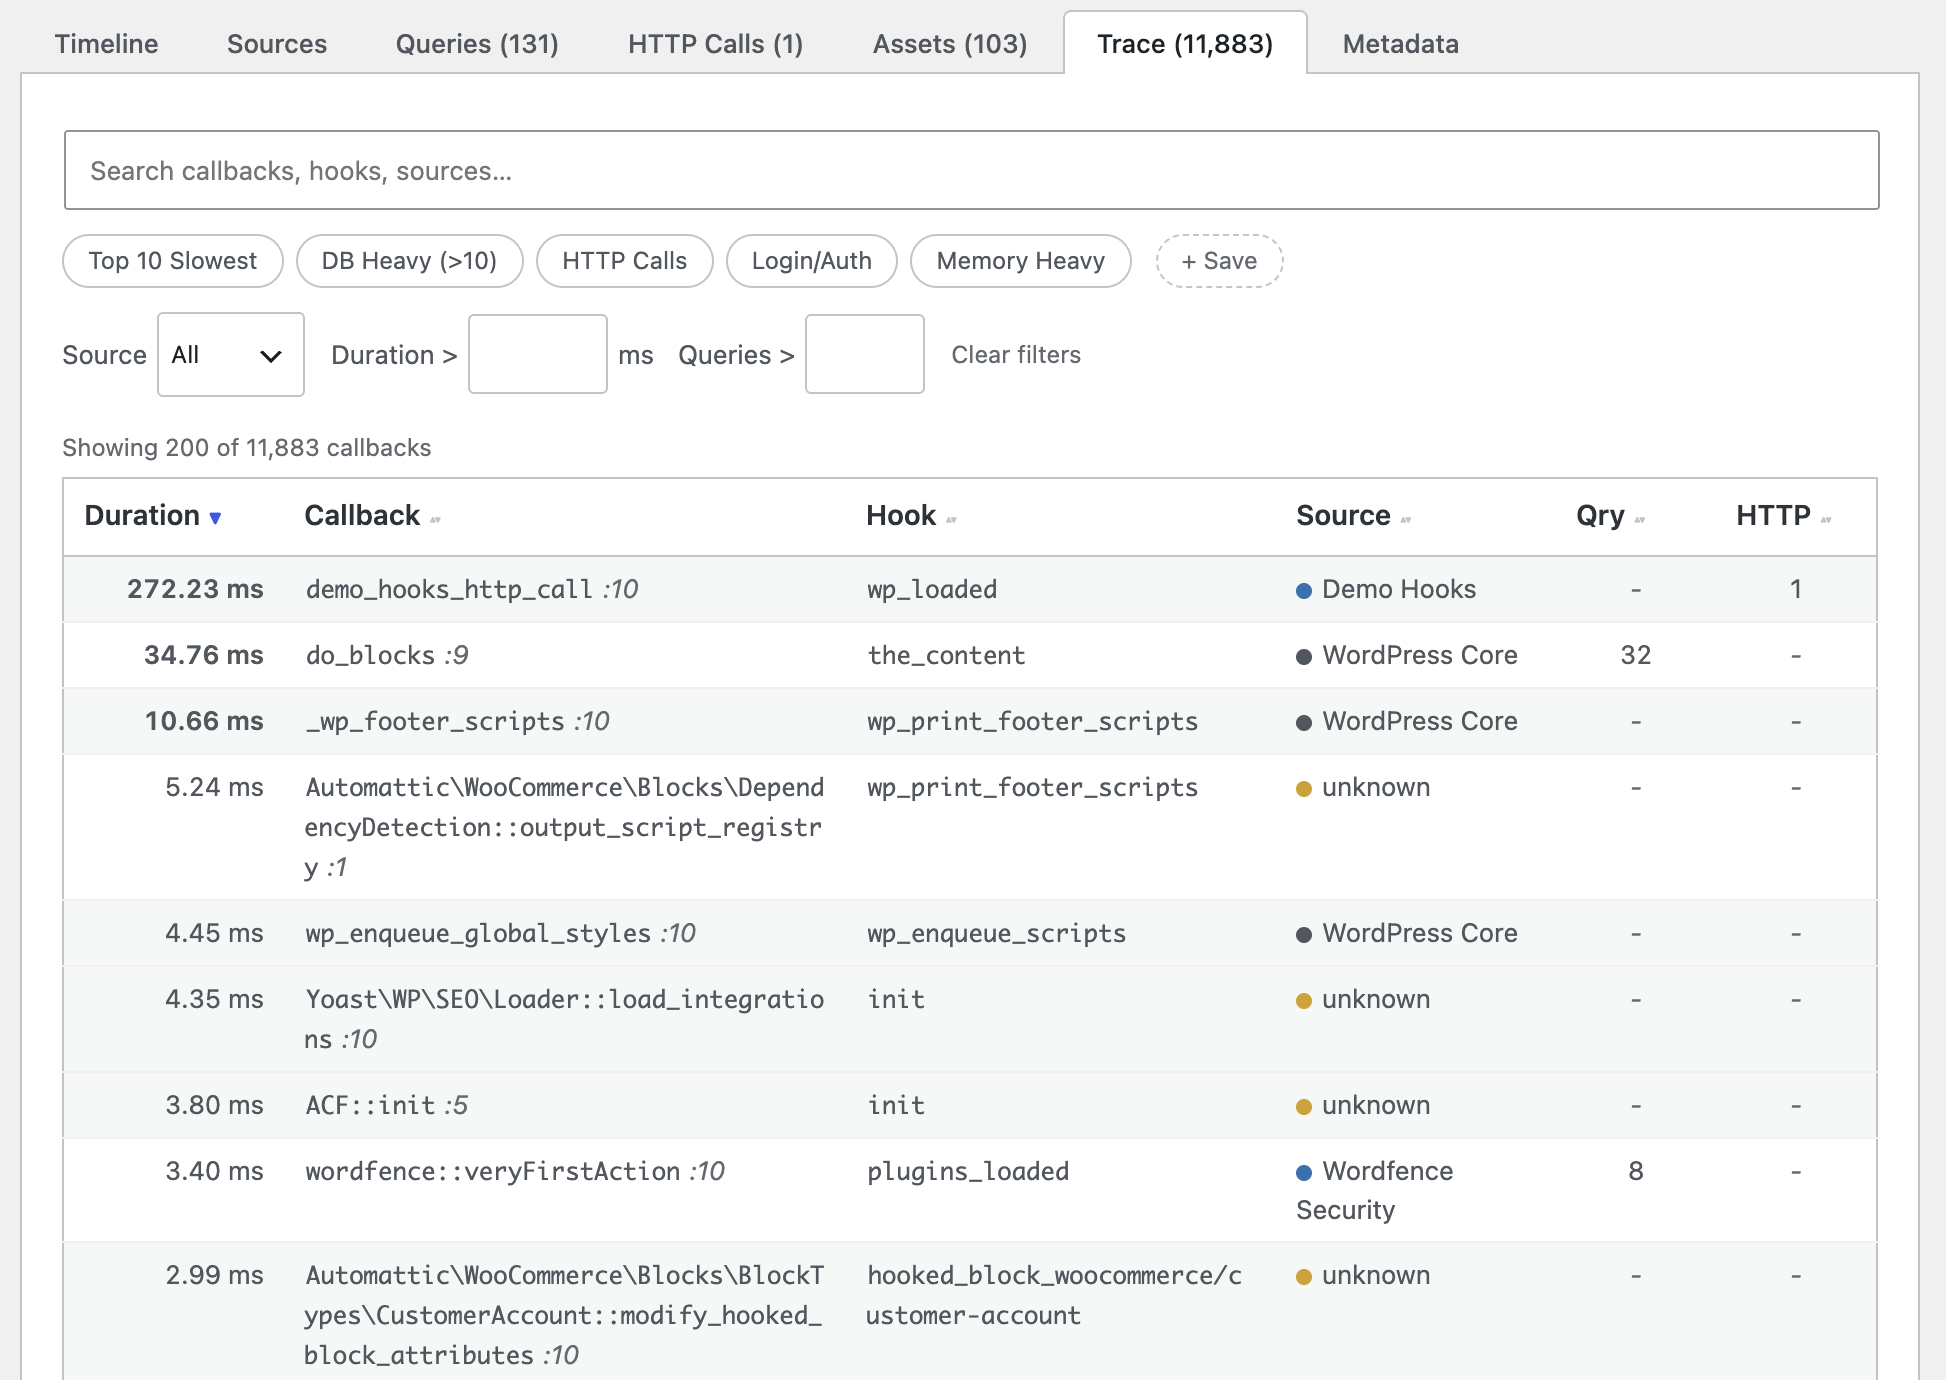
- Hook Execution Trace — Full callback tree by WordPress lifecycle phase
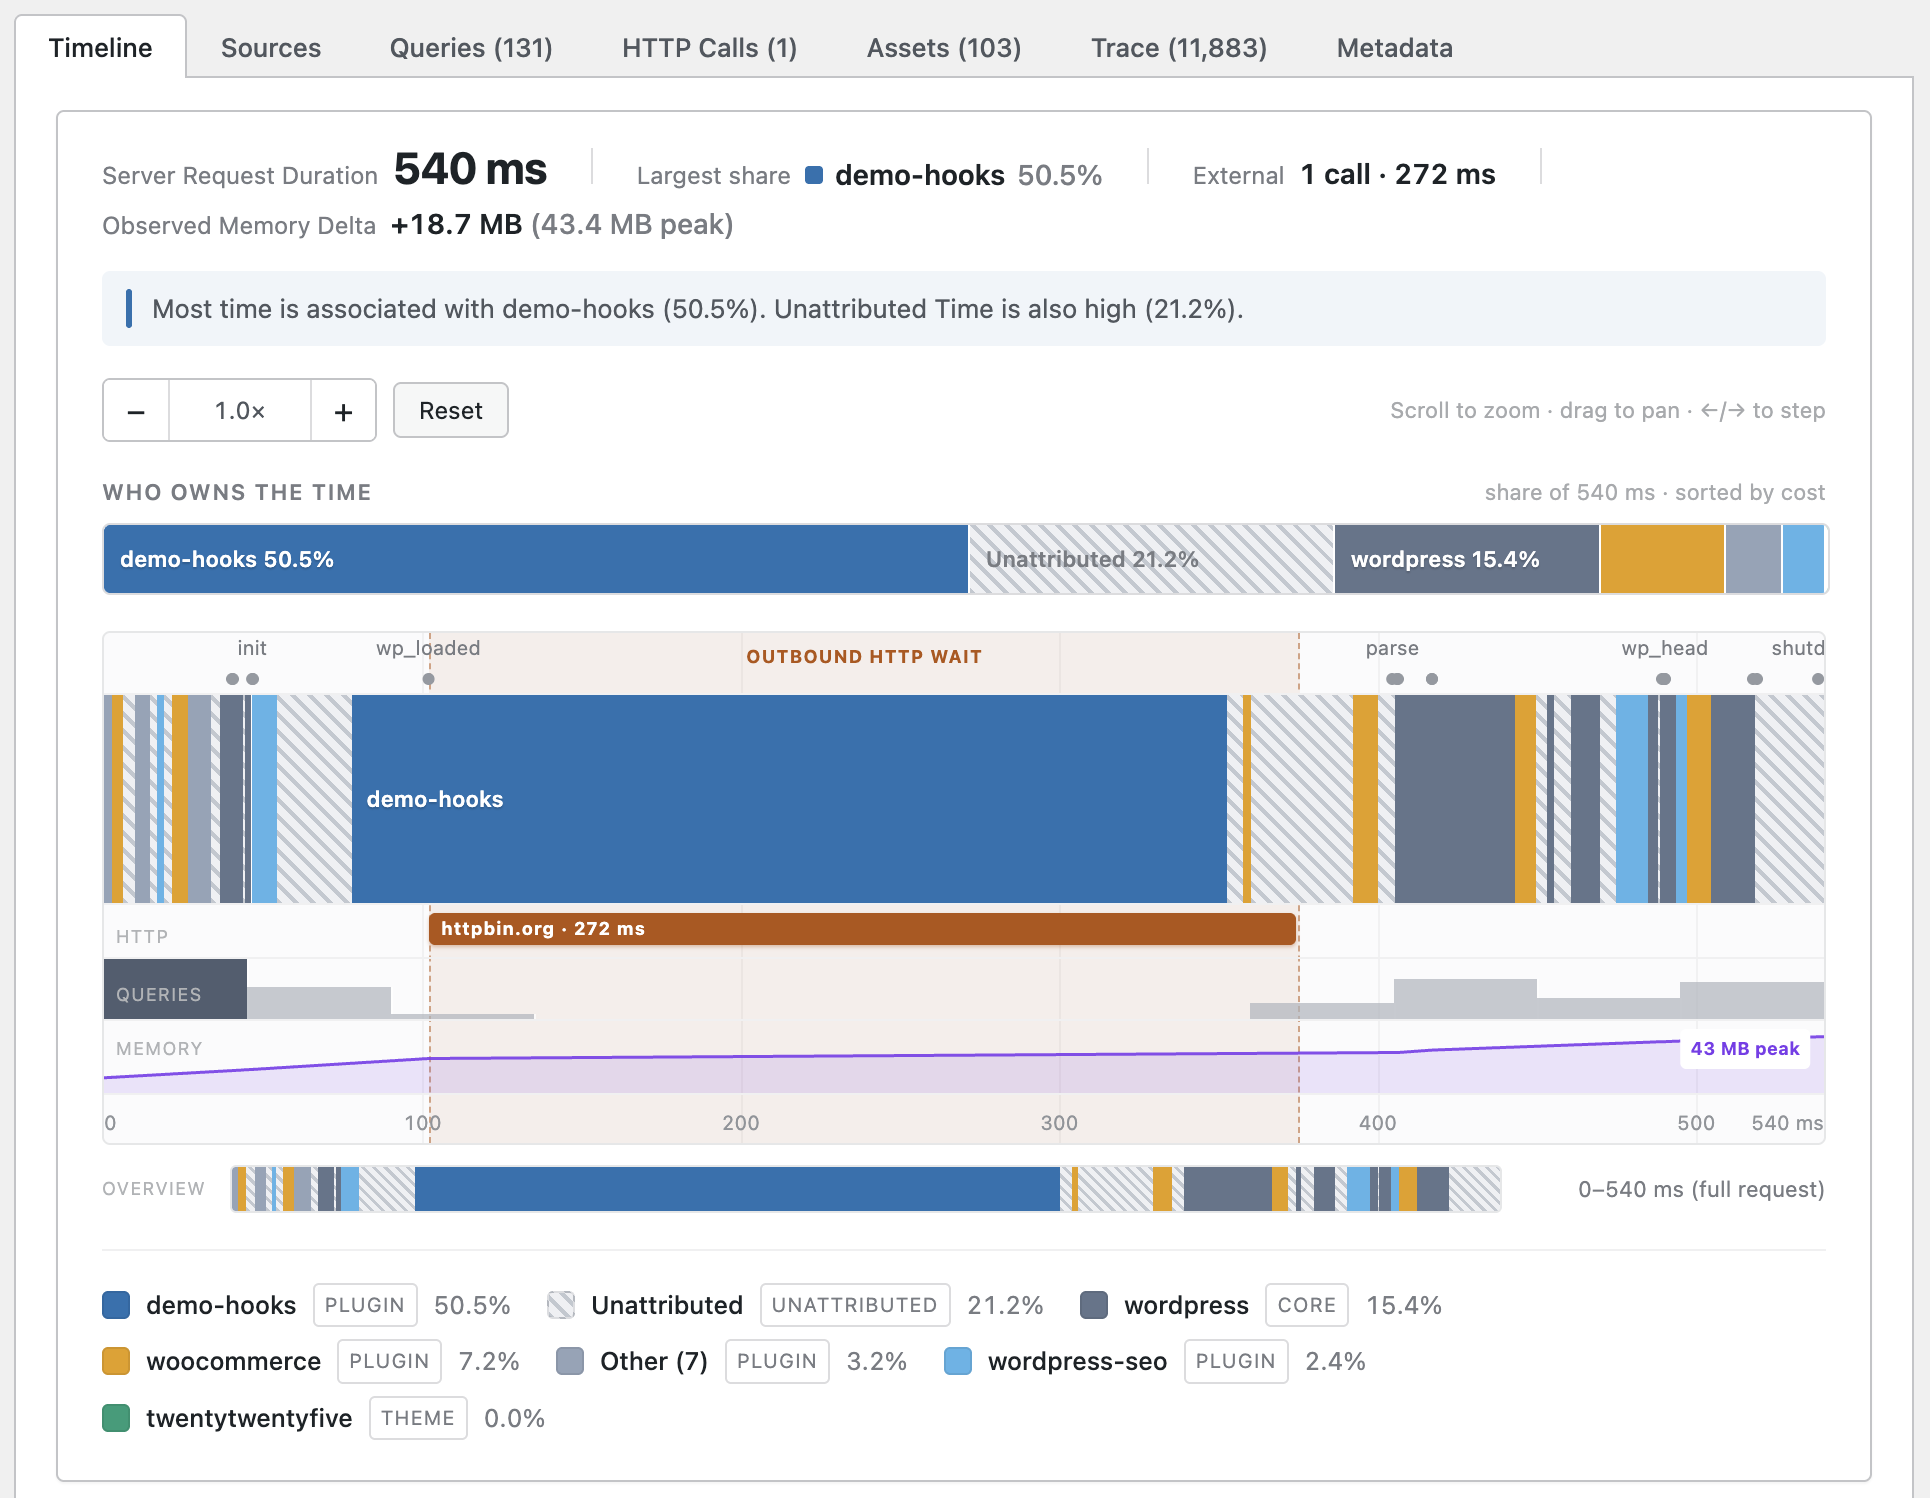
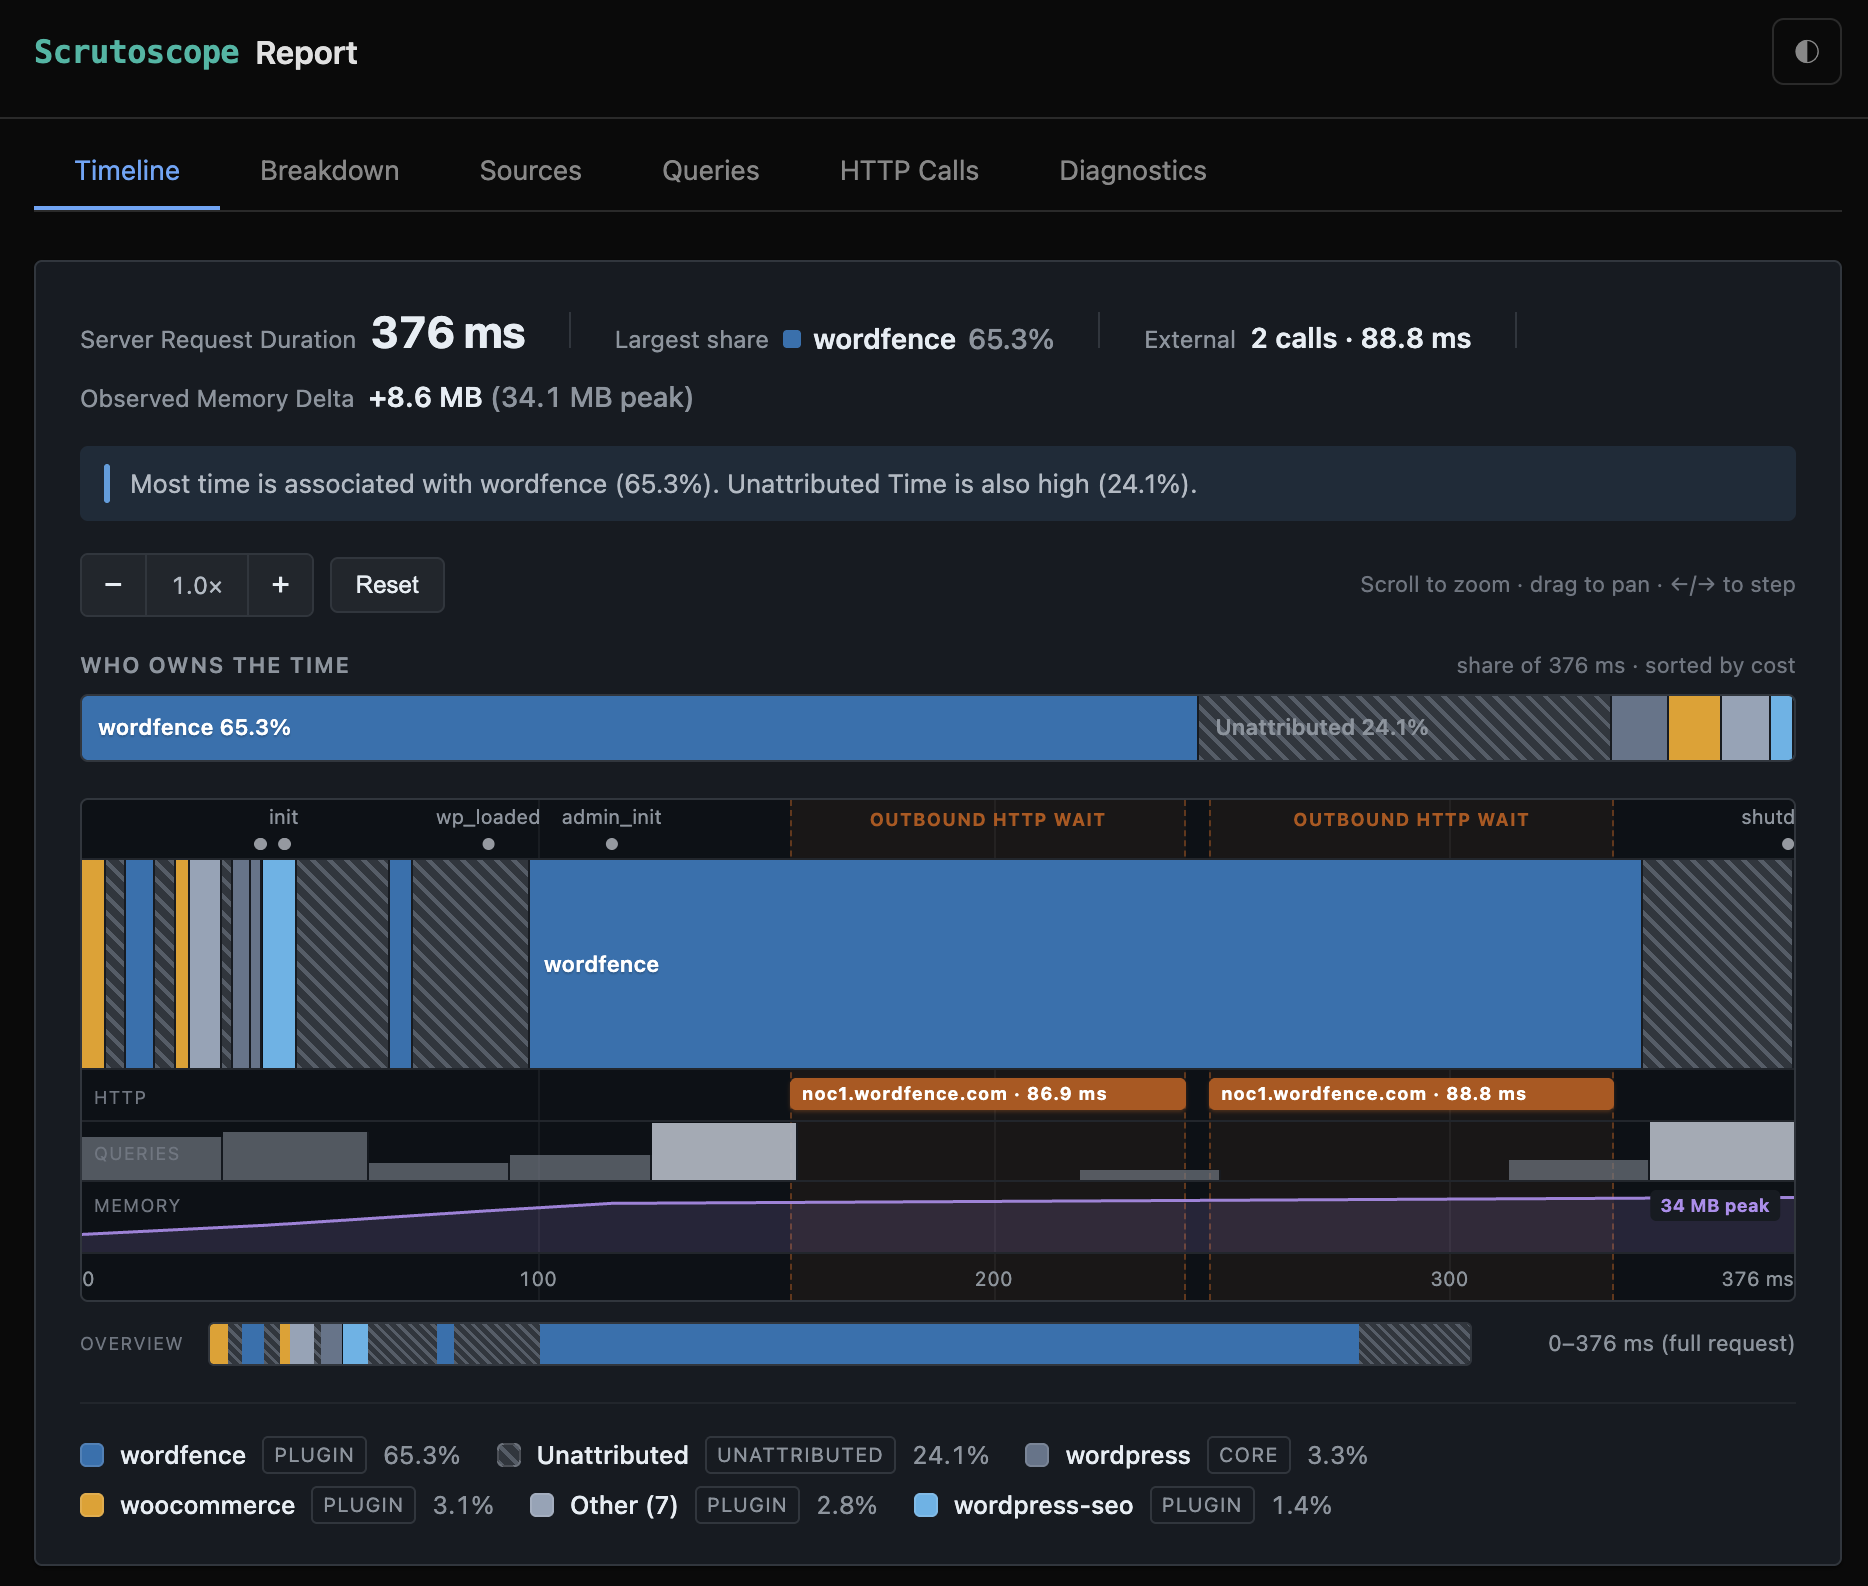
- Timeline — Redesigned request timeline: a cost-sorted ownership bar names the culprit, over a chronological view with phase markers, HTTP and query-density lanes, and a memory curve
Key Features
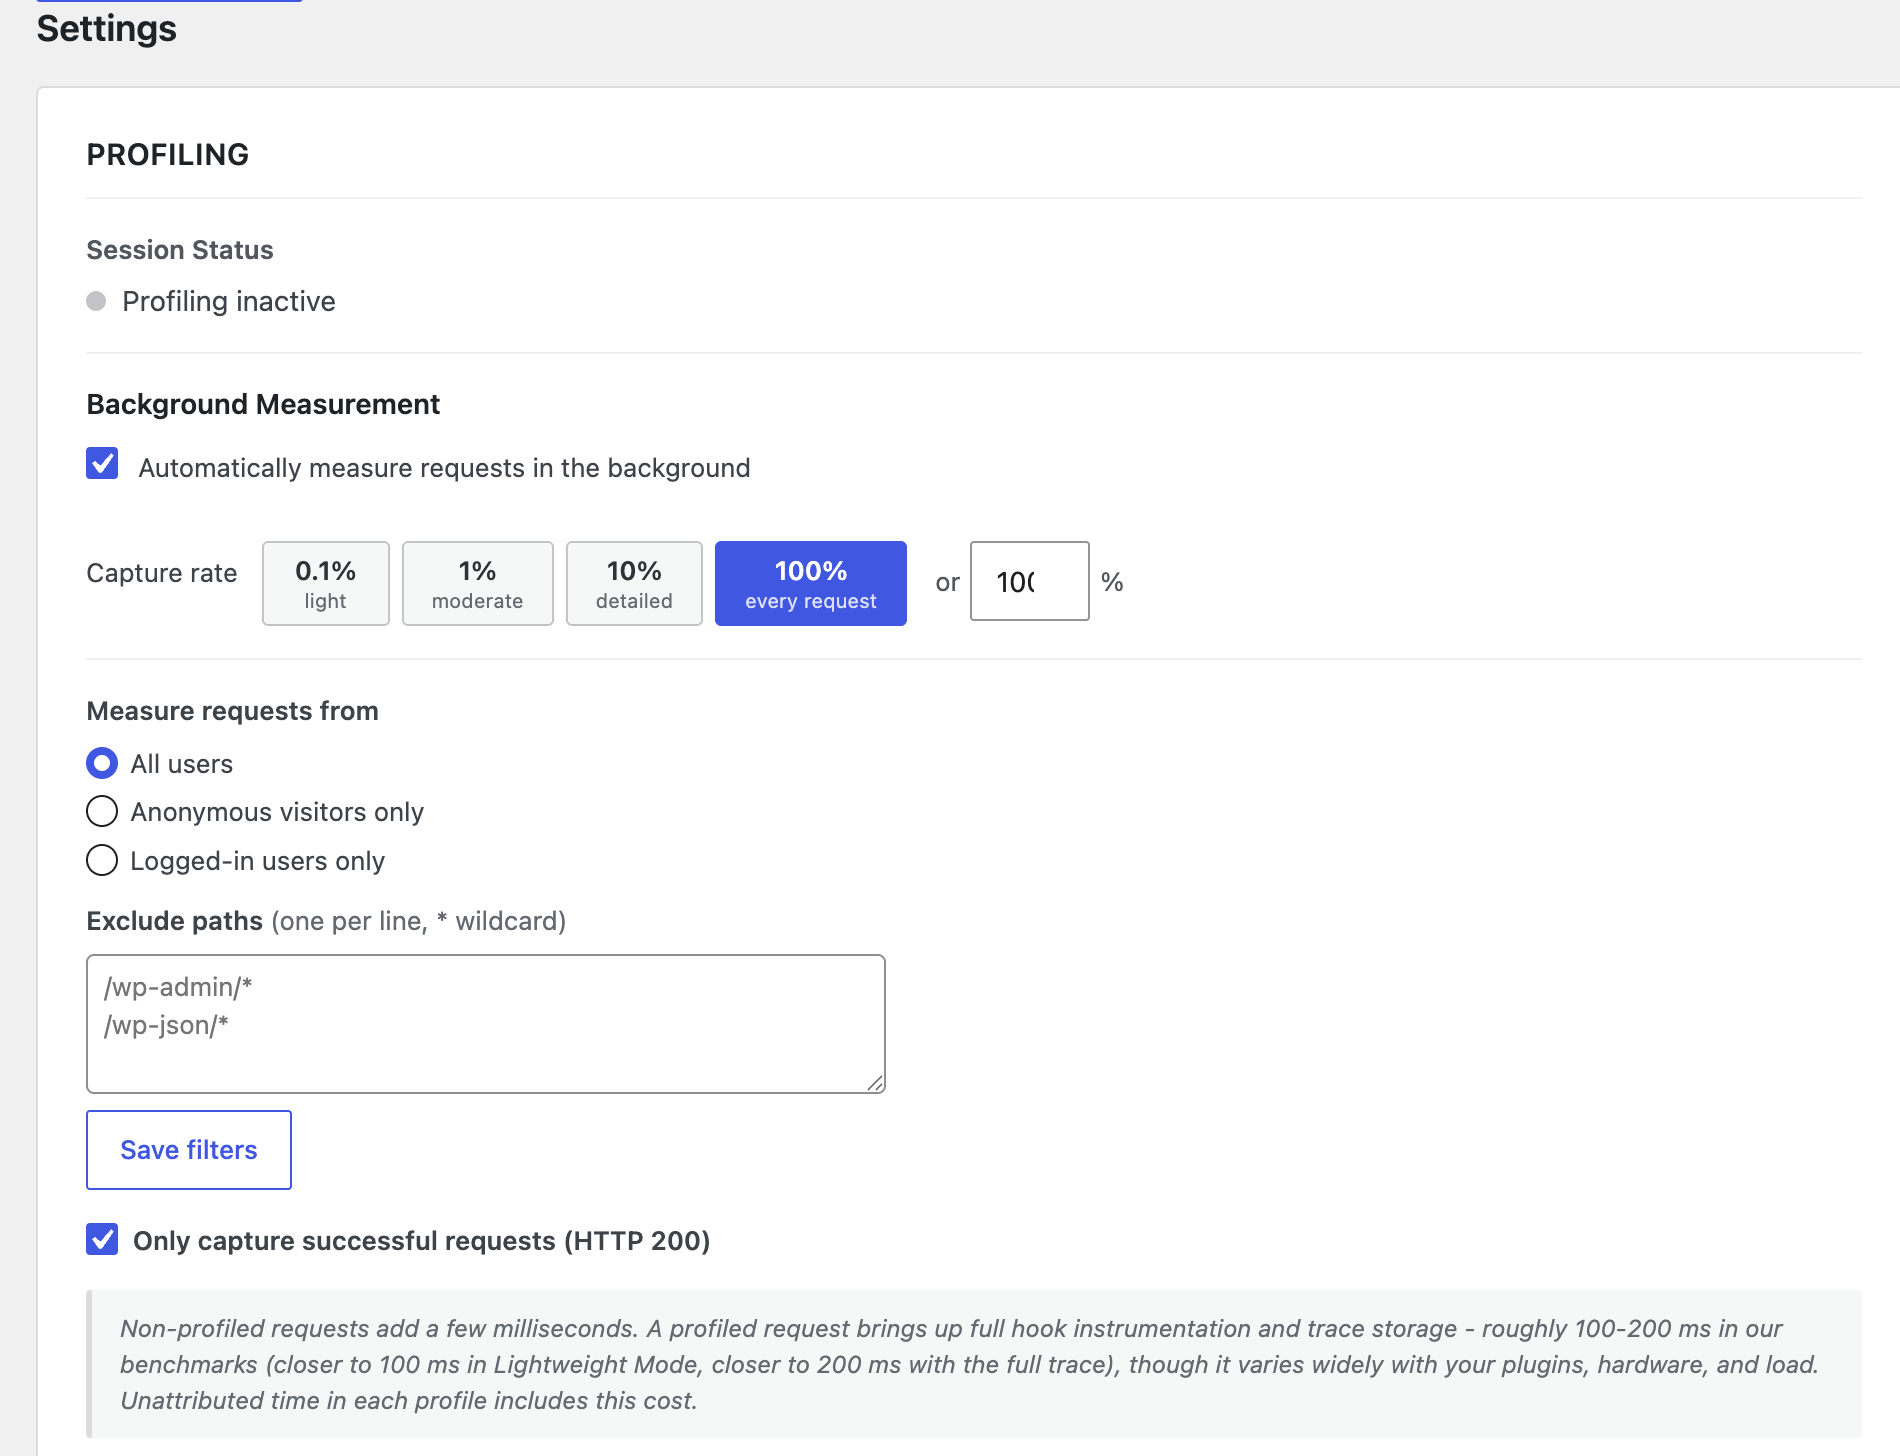
- Background capture with configurable sample rate (0.1%–100%)
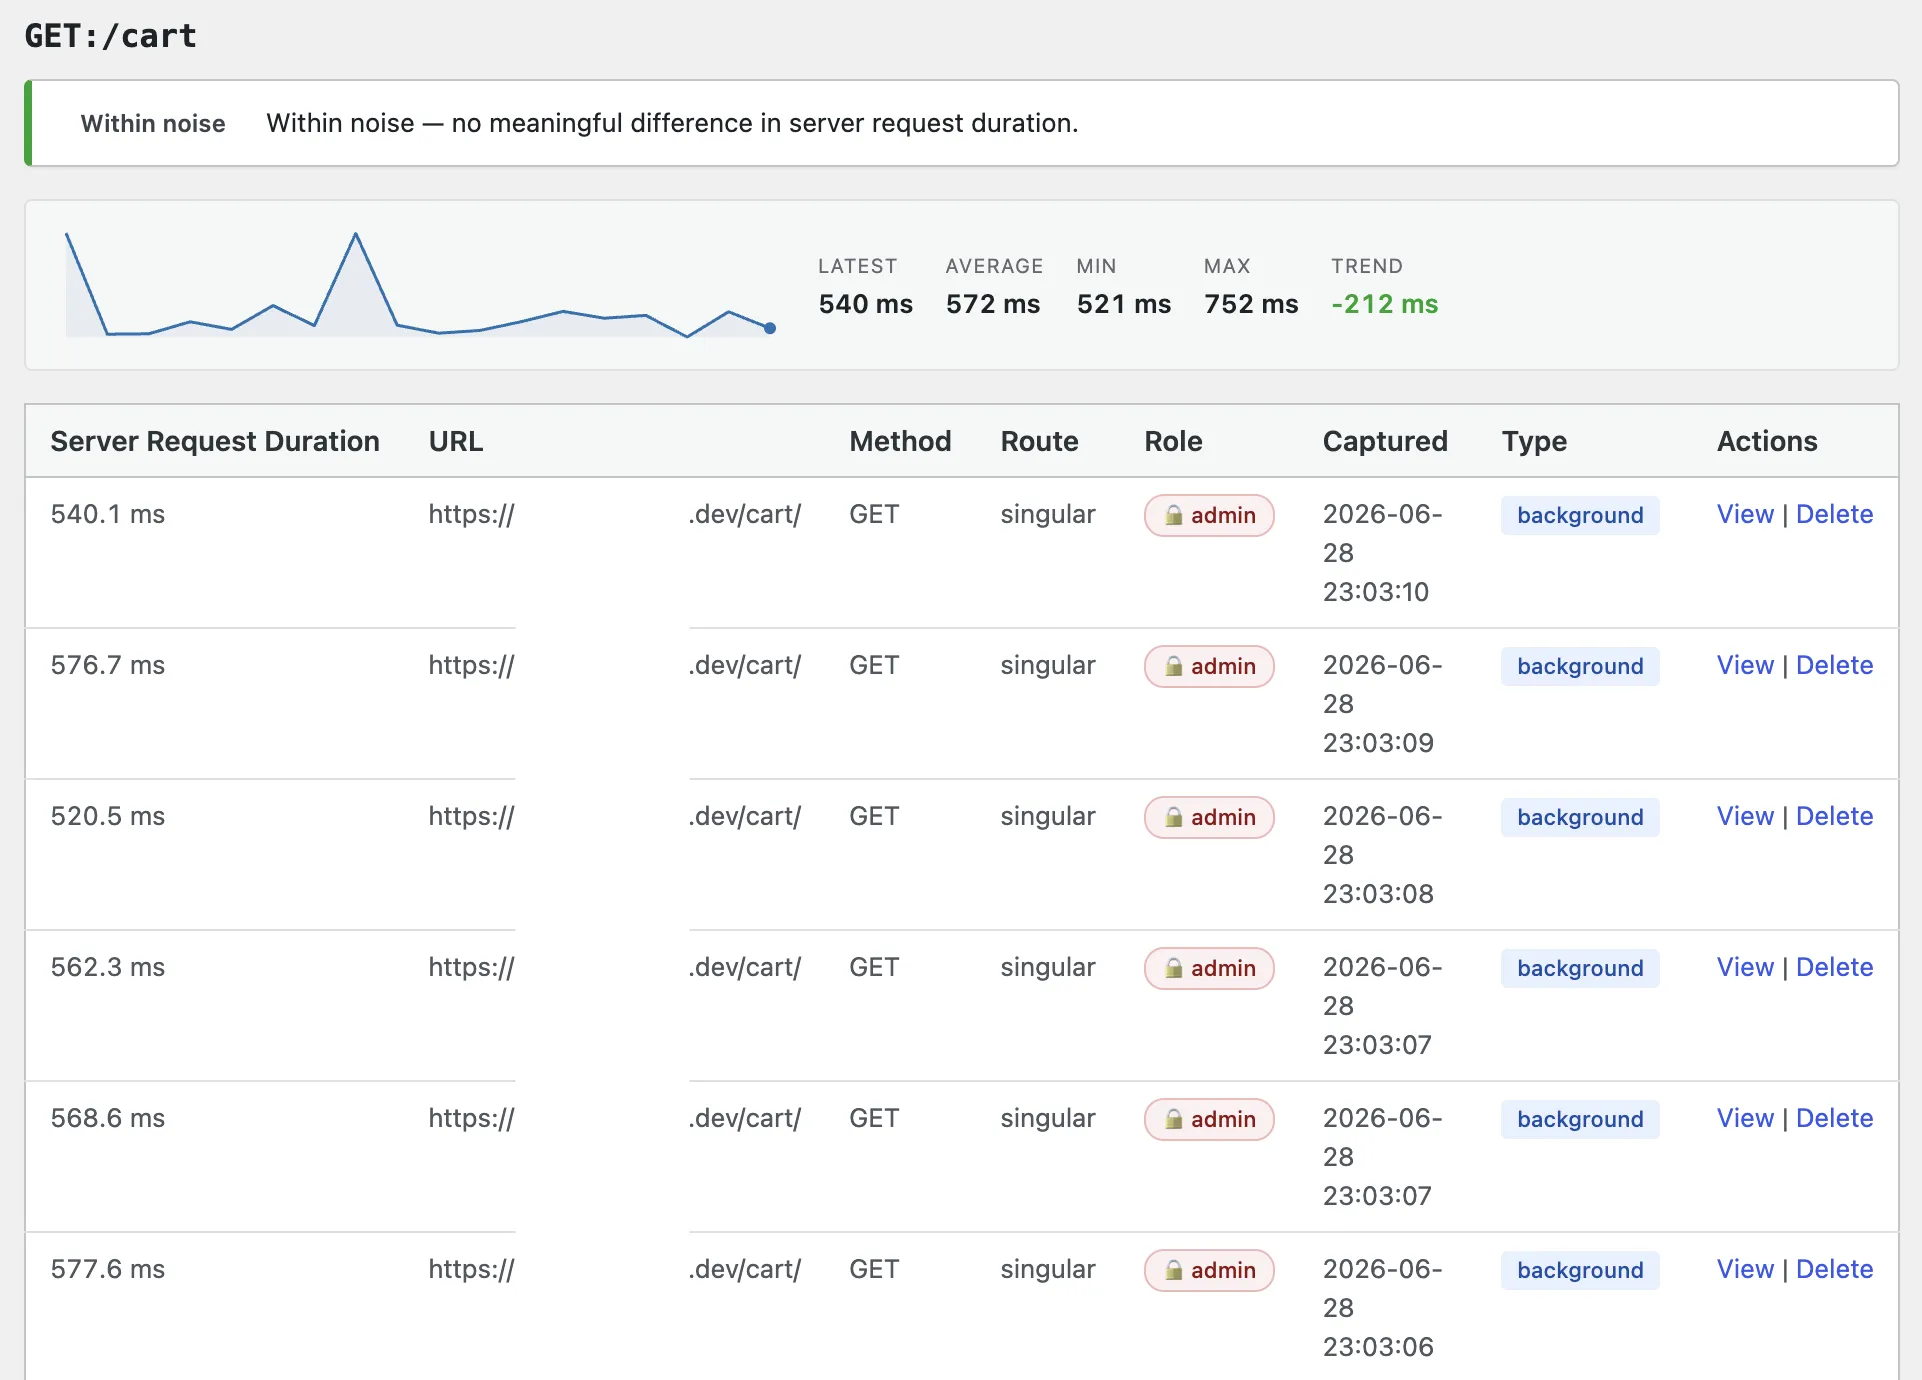
- Route-based grouping with human-readable labels and status code breakdown
- Pin & annotate profiles with notes and tags
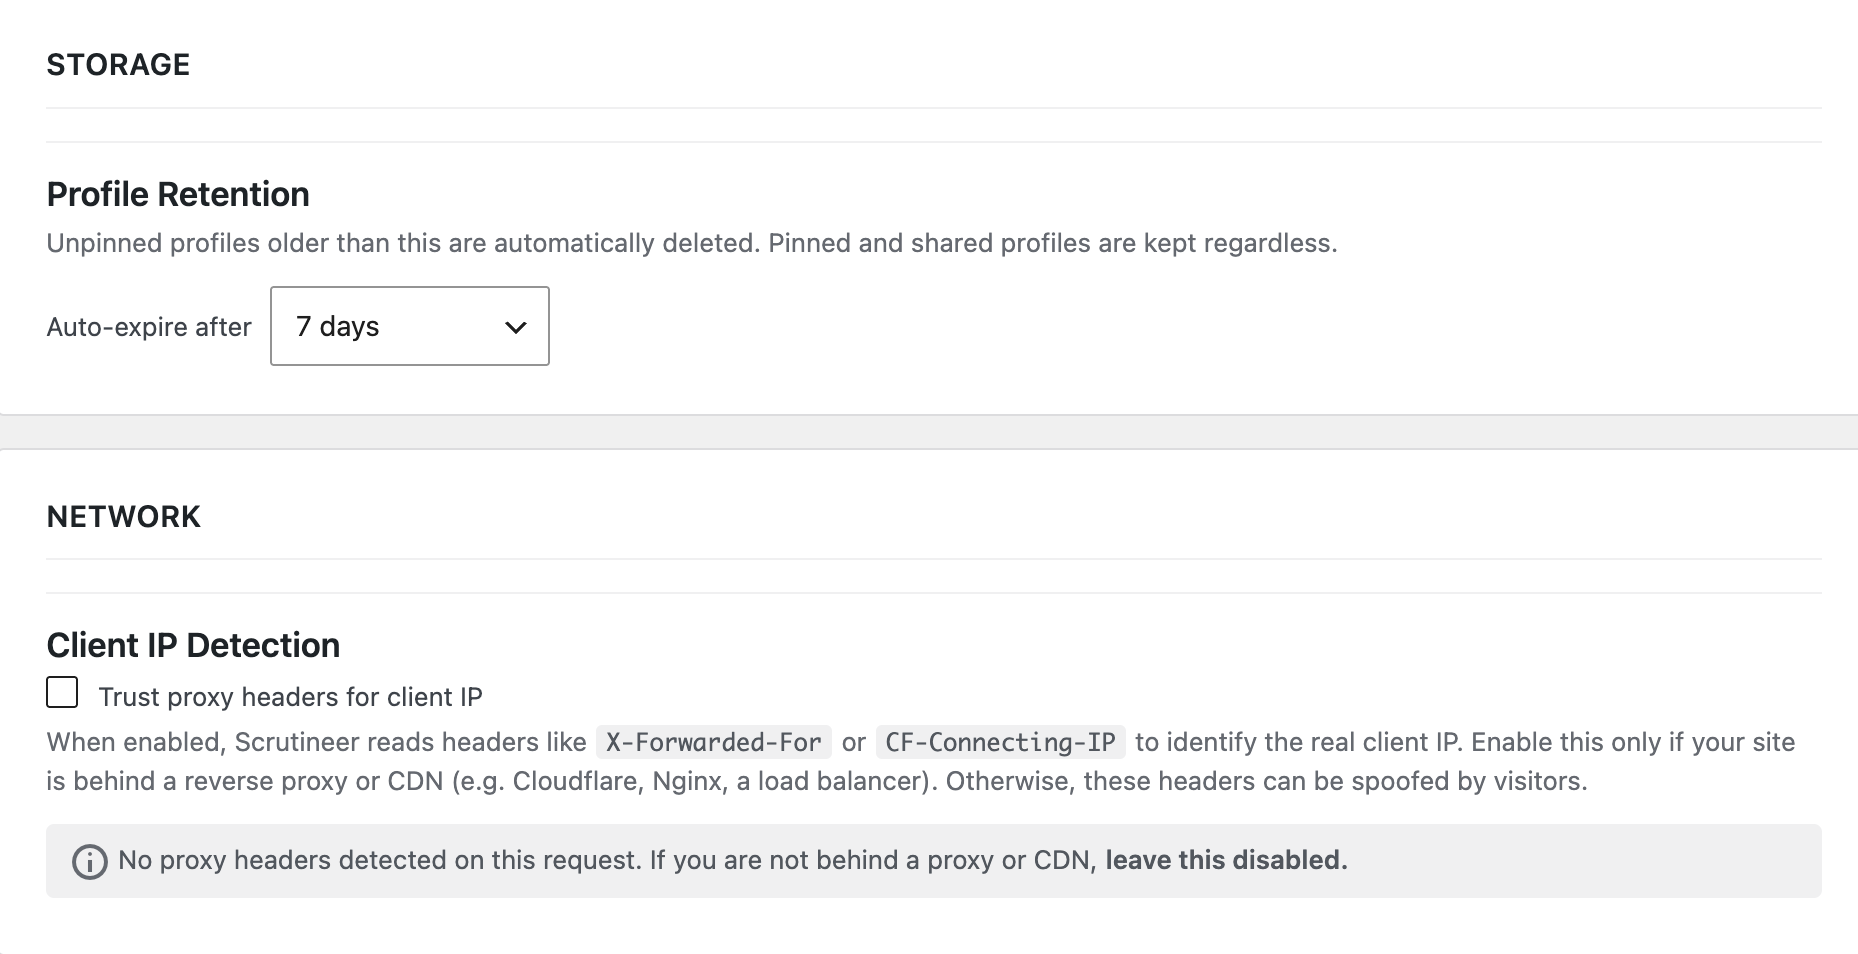
- Automatic retention — TTL + per-route cap, pinned profiles exempt
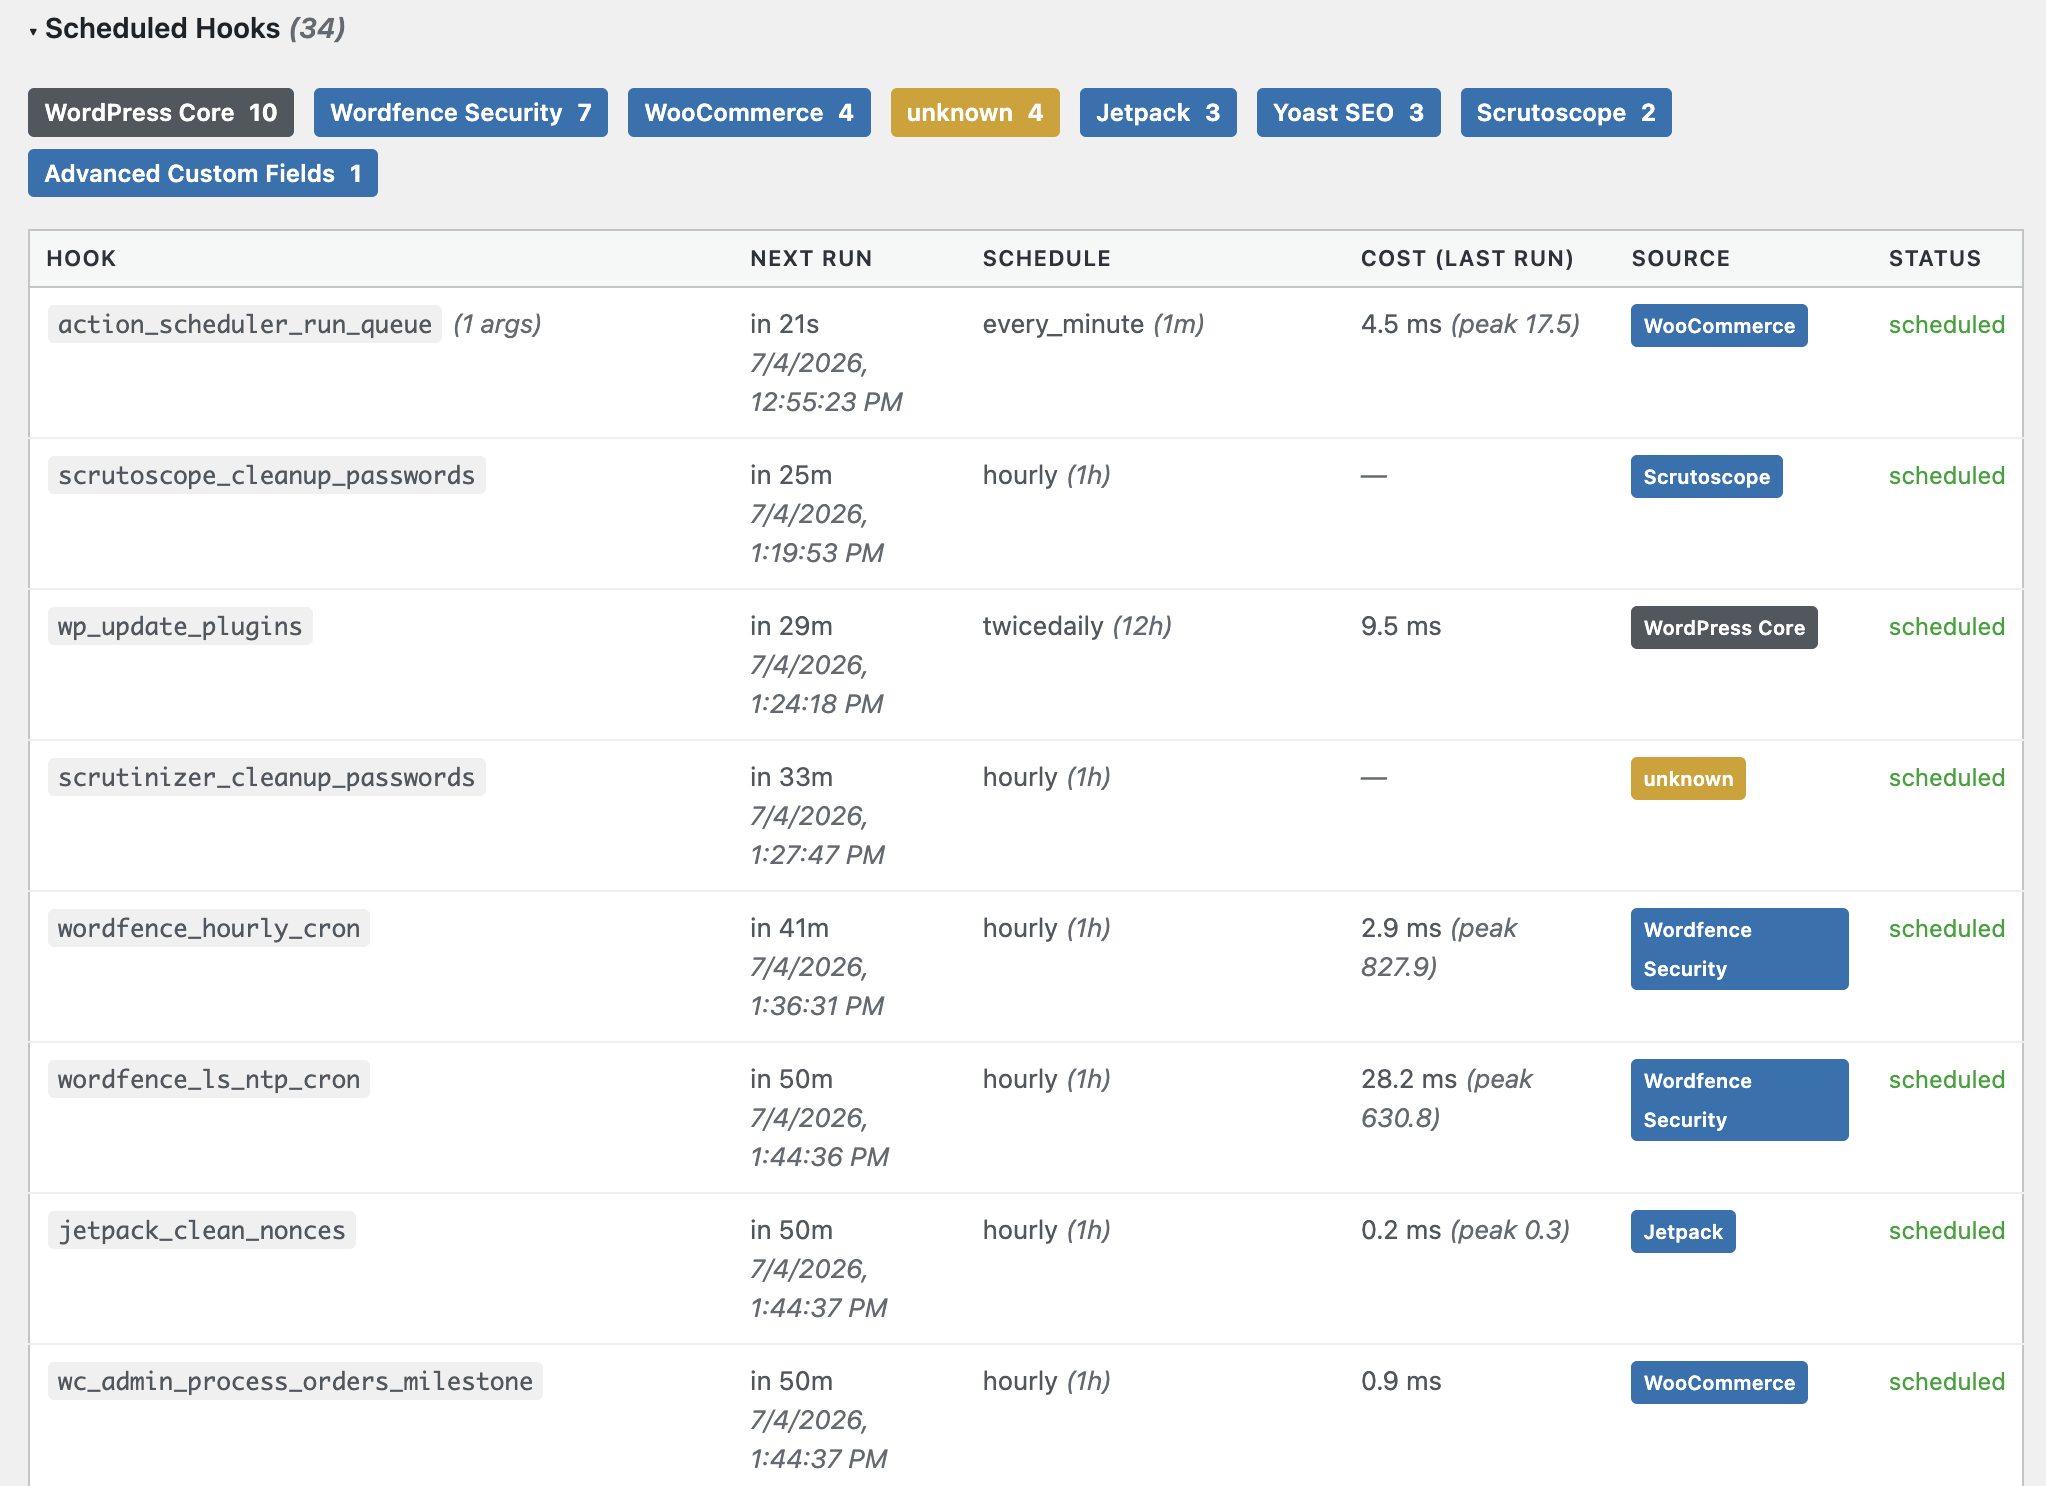
- Cron inventory — all registered WordPress cron events at a glance
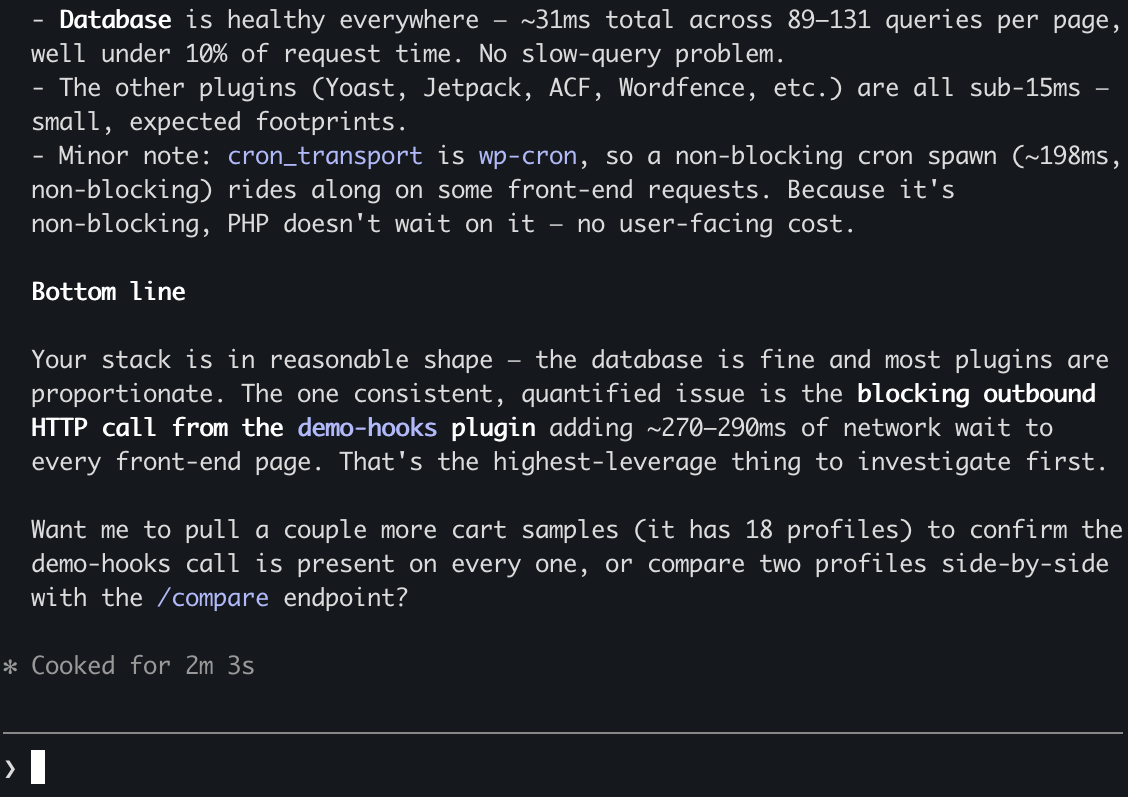
- REST API — seven read-only endpoints for AI agent integration
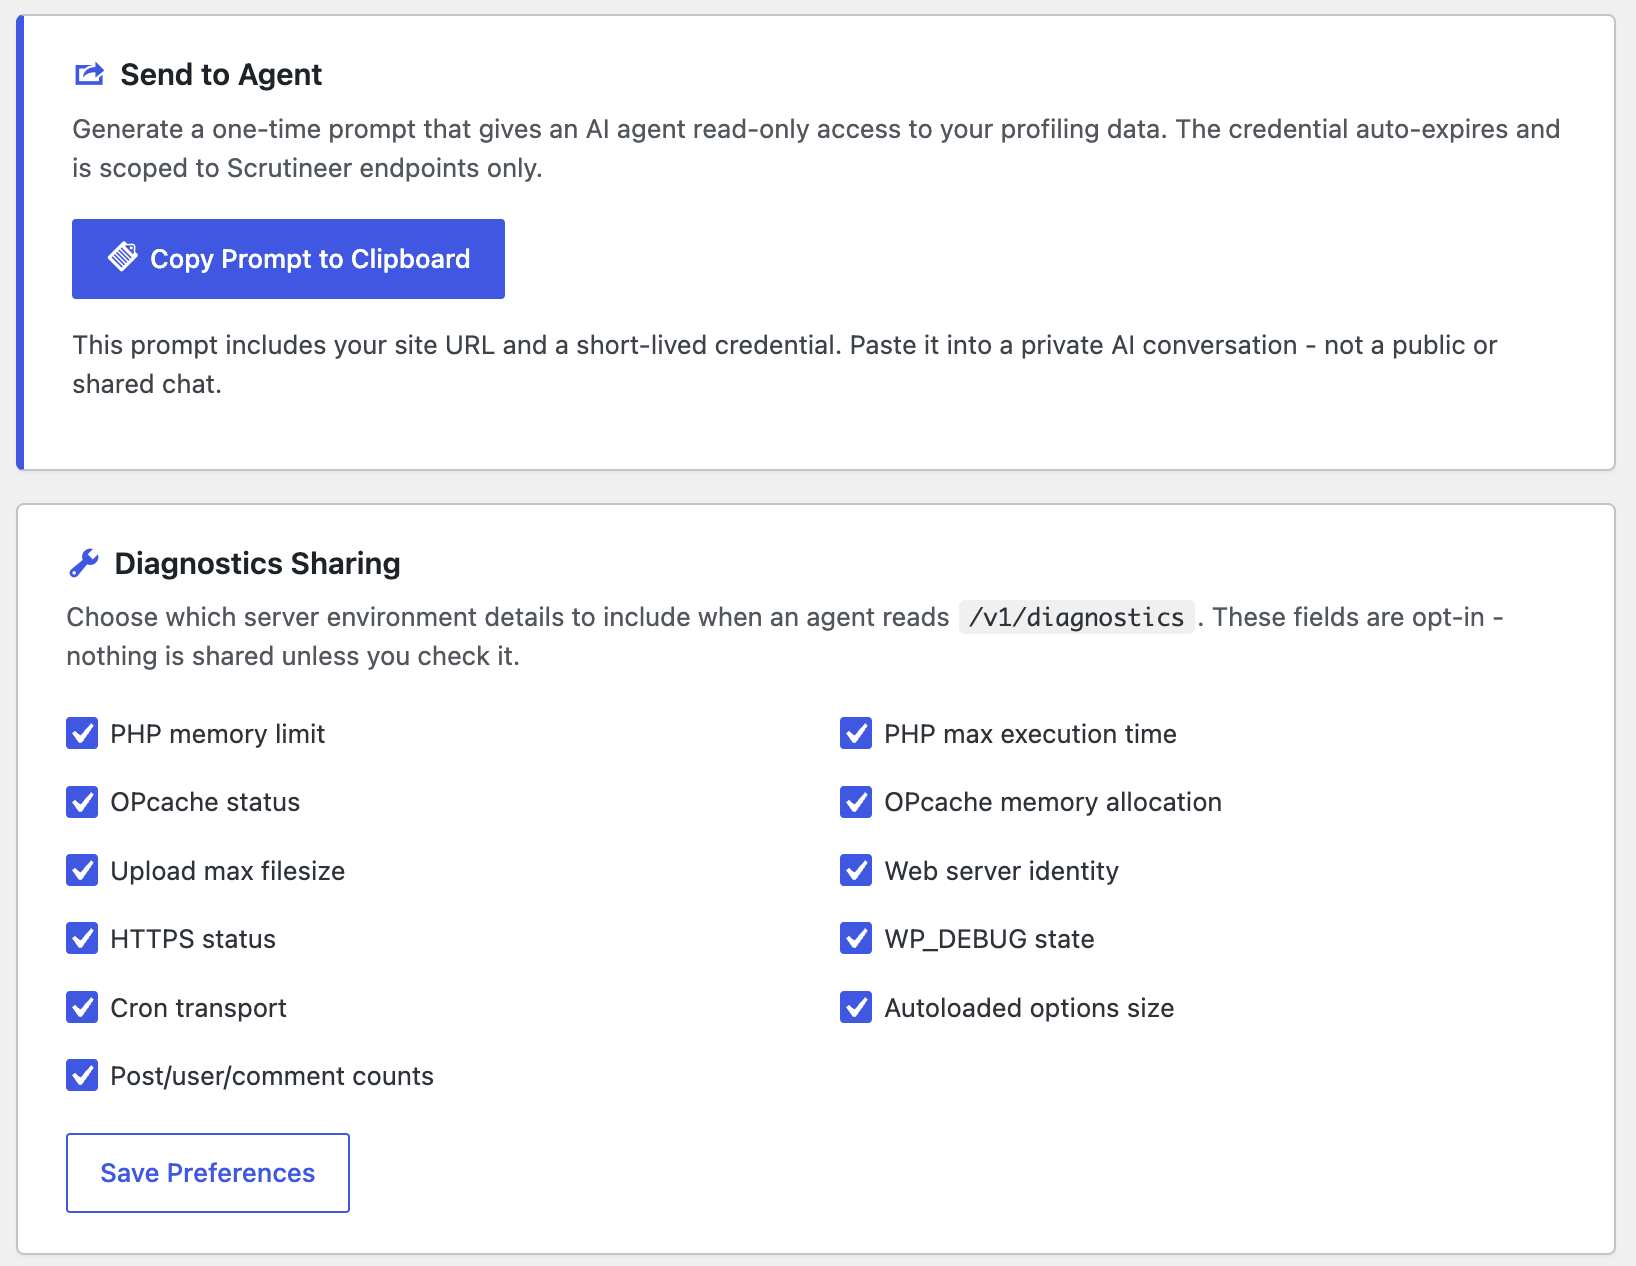
- Send to Agent — one-click prompt with short-lived credentials
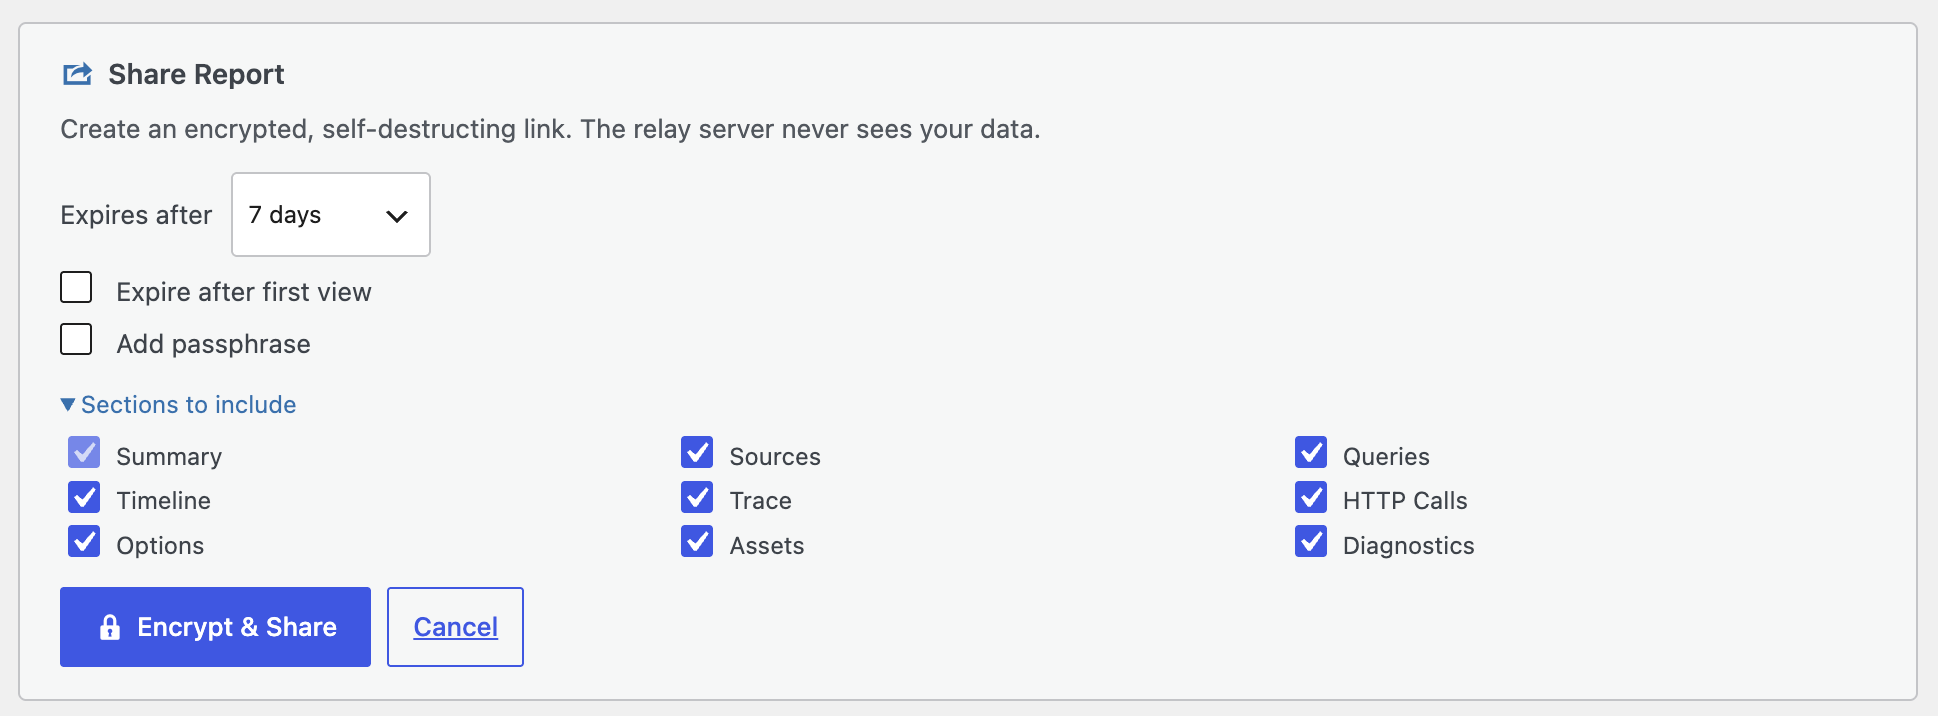
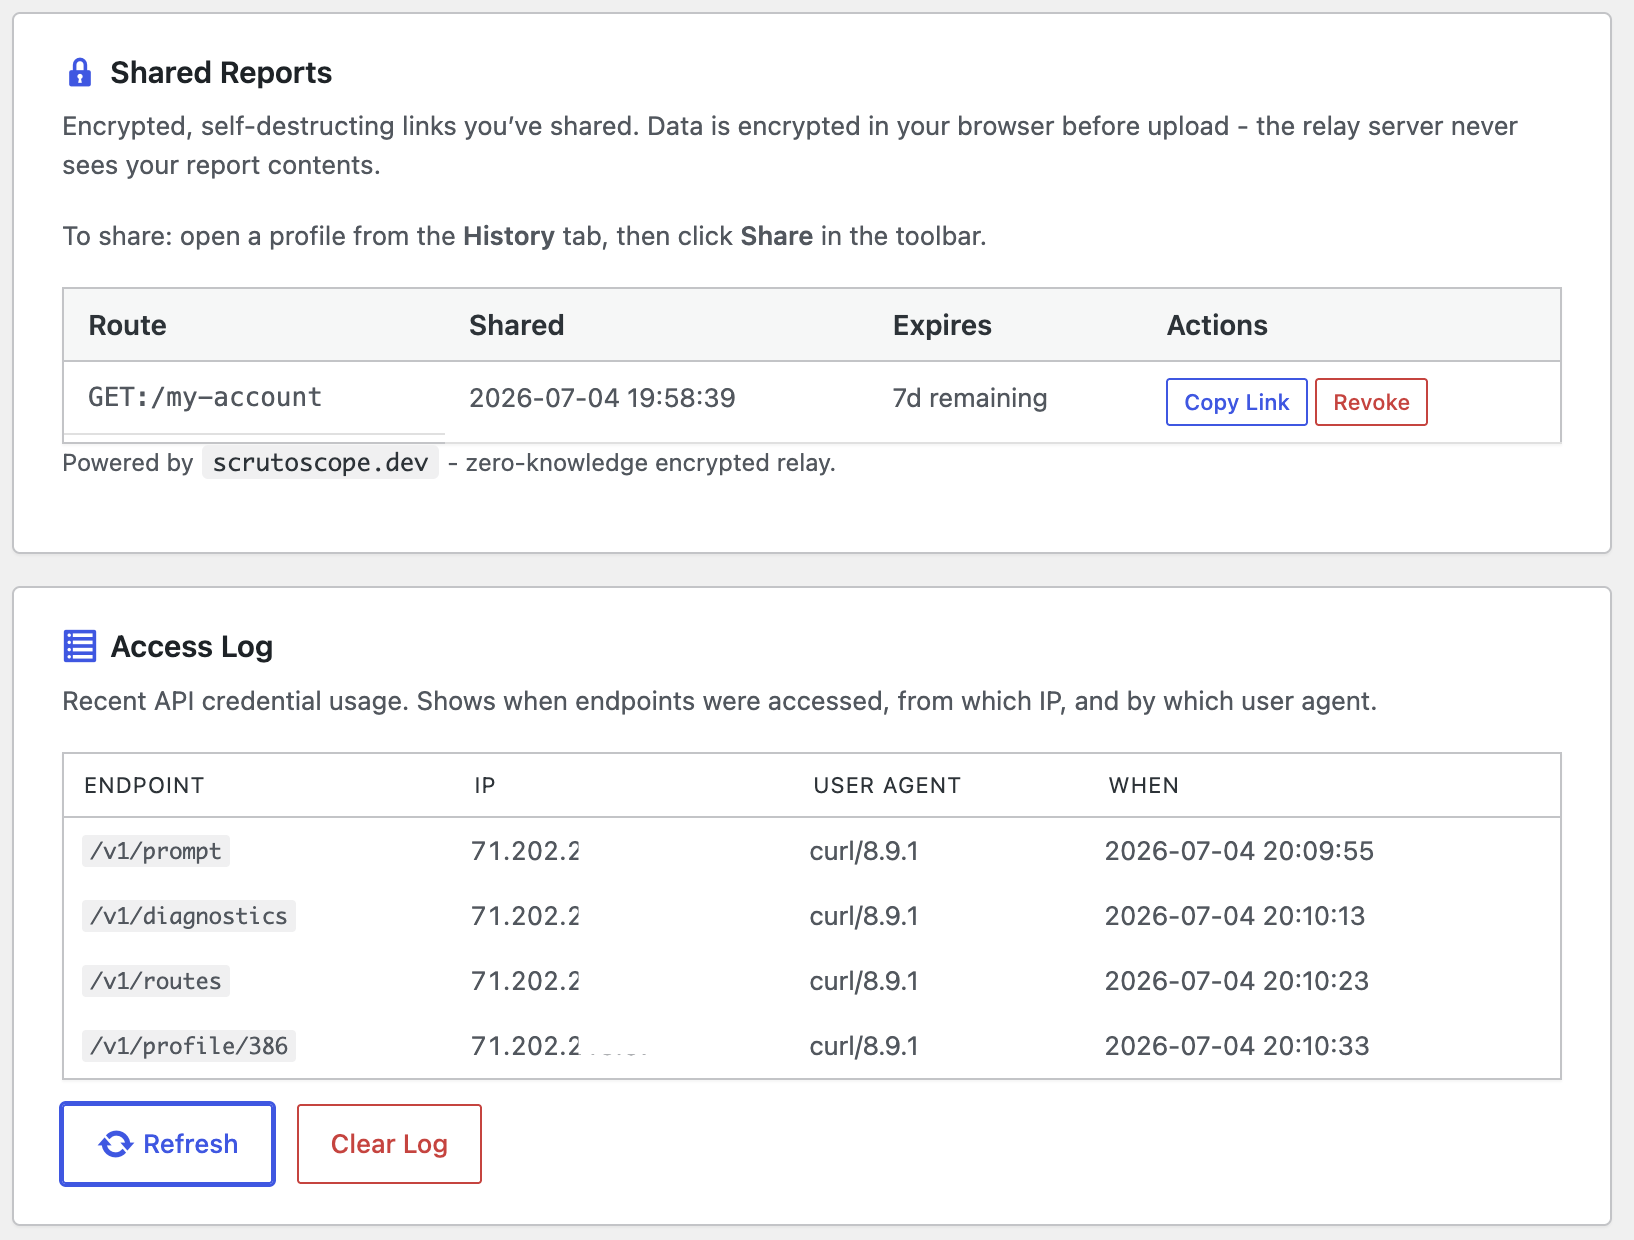
- Send to Support — zero-knowledge encrypted sharing
- WP-CLI —
wp scrutoscope status|list|show|delete|export|clear|rebuild-stats|mu-plugin
Design Philosophy
- Read-only by design — Scrutoscope does not change your content, themes, plugins, or site behavior. It stores its own profiling tables, settings, and scheduled cleanup events (plus a record per report you choose to share). Optional early-boot timing adds a small must-use plugin only when you enable it.
- Data first — The dashboard leads with profiling data, not settings.
- Off until asked — Background measurement, query profiling, and early-boot timing are all opt-in. A fresh install just adds its tables and a cleanup task.
- WordPress native — Standard admin patterns.
- Privacy by design — No telemetry. SQL is reduced to verb + table; outbound HTTP URLs are reduced to scheme + host. Sharing is opt-in and end-to-end encrypted.
External Services
Scrutoscope is local-first and does not phone home. It contacts exactly one external service, and only when you explicitly choose to share a report.
Service: Scrutoscope relay — zero-knowledge report sharing.
Provided by: The Scrutineer Project (https://scrutoscope.dev). Relay source: https://github.com/scrutineerhq/scrutoscope-relay
When it is contacted (admin-initiated only):
- When you click Send to Support / Encrypt & Share to create a shared report.
- When you revoke a report you previously shared.
- When you open a relay-hosted shared report link in your browser.
It is never contacted during normal profiling, page loads, or background capture.
What is sent:
- The encrypted report ciphertext and its initialization vector (IV).
- The time-to-live (TTL) you choose and an optional burn-after-reading flag.
- Key-derivation metadata if you set a passphrase — never the passphrase itself.
- A revoke token, so you can delete the report later.
- Normal HTTP request metadata (IP address, user agent) visible to any web service.
What is never sent:
- The decryption key — it stays in the URL fragment (after
#), which browsers never transmit to the server. - Your passphrase.
- Any plaintext profile data.
Data retention: a shared report expires after the TTL you choose, can be set to burn after its first read, and can be revoked manually at any time. The relay only ever stores ciphertext.
Screenshots

Installation
- Download the latest release from GitHub
- Upload the
scrutoscopedirectory towp-content/plugins/ - Activate through the Plugins menu
- Go to Tools Scrutoscope
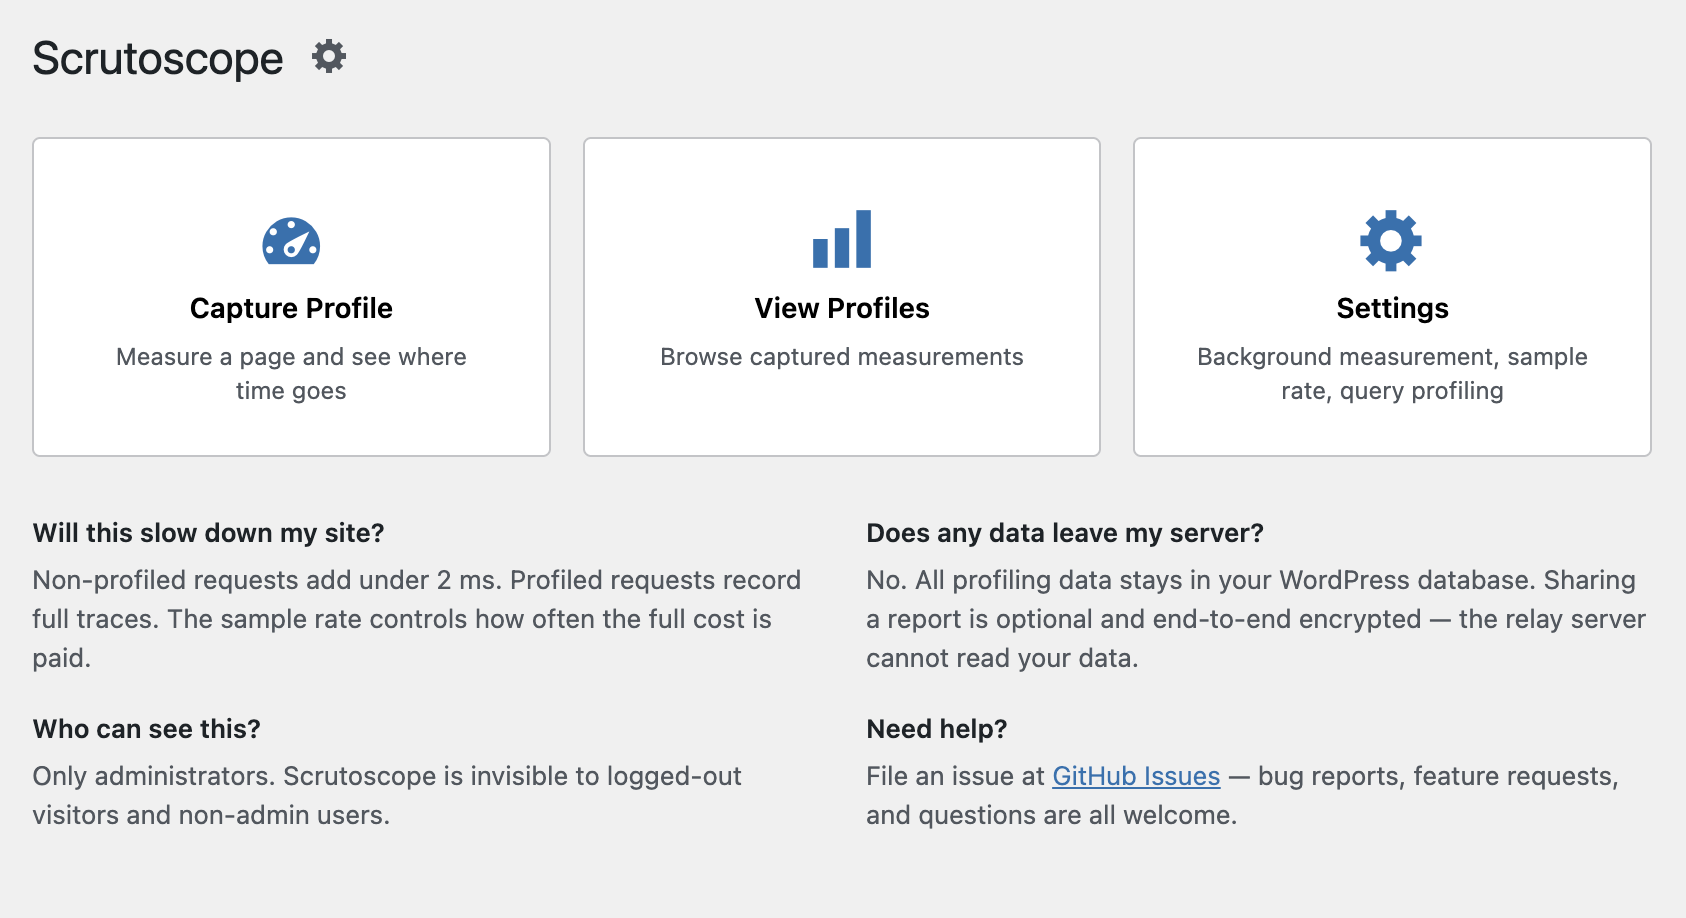
Background measurement is optional and off by default. To capture a profile, open Tools Scrutoscope and start a profiling session, or enable background measurement with a sample rate you choose.
FAQ
-
Does Scrutoscope slow down my site?
-
There are two kinds of overhead. An always-on check on every request — a few milliseconds — decides whether the request is being profiled; this is what every visitor pays, and it’s negligible. When a request is being profiled (an admin session, or the sampled fraction of background traffic), instrumenting the hooks and timing every callback adds roughly 100-200ms in our benchmarks (closer to 100ms in Lightweight Mode, closer to 200ms with the full trace). Both vary a lot with your environment — number of active plugins, OPcache, whether MySQL is local or remote, your hardware, and current load — so we report what we measured rather than promising a number. Background measurement is off by default; when you turn it on you choose the sample rate, and at a low rate most requests only pay the few-ms check. Query detail is a separate opt-in: enabling Query Profiling turns on WordPress
SAVEQUERIES, which makes WordPress keep query text, timing, and caller in memory for the request — extra overhead you only pay when you ask for query detail, so leave it off when you just need request and source timing. And you’re always one click from zero: deactivating Scrutoscope removes all overhead and keeps your captured profiles (only deleting the plugin removes the data). -
What data leaves my server?
-
Nothing, unless you choose to share a report. The “Send to Support” feature encrypts your report in the browser before upload. The relay server never sees your data. No telemetry, no analytics, no phone-home.
-
Does it work with WooCommerce?
-
Yes. Scrutoscope profiles any WordPress request, including WooCommerce pages, AJAX calls, and REST API endpoints.
-
Can I use it on a production site?
-
Yes, with a low sample rate (0.1% or 1%). Scrutoscope is designed for background capture at scale. Use higher rates for focused debugging.
Reviews
There are no reviews for this plugin.
Contributors & Developers
“Scrutoscope” is open source software. The following people have contributed to this plugin.
Contributors
Translate “Scrutoscope” into your language.
Interested in development?
Browse the code, check out the SVN repository, or subscribe to the development log by RSS.
Changelog
1.3.4
- Replaced rename() with WP_Filesystem move() for mu-plugin migration
1.3.3
- Replaced file_put_contents with WP_Filesystem put_contents in WP-CLI export
- Absolute export paths now restricted to uploads/scrutoscope/ (not uploads tree root)
1.3.2
- Restore anonymous profiling — activation URL works in incognito/logged-out browsers again
- WP-CLI exports now write to uploads/scrutoscope/ subdirectory (not uploads root)
- Absolute export paths restricted to uploads tree
- Replaced all file_get_contents with WP_Filesystem throughout
1.3.1
- Request URLs display as paths only (domain stripped)
- Access log stores raw IPs and full user agents for security auditing
- Rebuilt minified assets
- Updated screenshots
1.3.0
- Renamed plugin from “Scrutinizer” to “Scrutoscope”
- Updated all namespaces, database tables, REST API, WP-CLI commands, option keys, and handles
- Automatic migration from old names on upgrade
- Relay endpoint moved to scrutoscope.dev
1.2.7
- Fix: Moved inline scripts to wp_register_script/wp_add_inline_script for wp.org compliance.
- Fix: Removed unnecessary require_once for plugin.php.
- Fix: Switched file_put_contents to WordPress uploads directory via wp_upload_dir().
- Fix: Replaced copy() with WP_Filesystem API for mu-plugin installation.
1.2.6
- New: Inline trend sparklines in the routes overview table with regression coloring.
- New: Sortable memory delta column in hook execution trace.
- Fix: Routes tab first-load race condition — cached data renders immediately on tab switch.
- Fix: Revoke button icon vertical alignment.
- Fix: Client IP detection settings description reworded.
1.2.5
- Fix: Replace heredoc syntax in Prompt.php for Plugin Check compatibility.
- Fix: Remove deprecated load_plugin_textdomain call (handled by wp.org since WP 4.6).
- Fix: Sanitize $_SERVER[‘REQUEST_URI’] with wp_unslash.
- Fix: Trim upgrade notice for 1.1.0 to under 300 characters.
- Fix: Update contributor to kurtpayne.
1.2.3
- Refactored Storage class (1,619 lines) into four focused classes: Storage, Schema, StorageRouteAggregates, Cleanup
- Added ABSPATH guards to all PHP files
- Added minified assets (39% smaller when SCRIPT_DEBUG is off)
- Fixed uninstall to query only users with Application Passwords instead of all users
- Streamlined screenshots from 21 to 15
- Fixed REST endpoint and CLI subcommand counts in documentation
- Added route normalization tests
1.2.2
Cron visibility, sharing fixes, and wp.org polish.
- New: Cron tab reorganized into collapsible source sections with recent cron profile history.
- New: Routes view now paginates client-side for sites with many measured routes.
- New: Send to Agent prompt simplified — bootstraps from /v1/prompt instead of embedding the full prompt inline.
- Fixed: Shared report timeline now shows correct plugin names and colors.
- Fixed: Shared report trace rendering restored.
- Fixed: False-positive duplicate cron warnings eliminated.
- Fixed: DESCRIBE/DESC/EXPLAIN queries no longer lose their table name in query grouping.
- Changed: Removed JIT textdomain section from Metadata tab (no longer relevant on WP 6.7+).
- Changed: Share payload passes fields through directly — no more field renaming.
- wp.org: Added 21 screenshots, HiDPI banners, and updated readme descriptions.
1.2.1
Capture experience polish.
- New: Capture feedback banner – floating bottom bar on every profiled page confirms profiling is active and encourages continued browsing. Works on admin pages, front-end logged in, and front-end logged out.
1.2.0
Production-safe capture and cron visibility.
- New: Lightweight capture mode (Settings Lightweight Mode) — records source/attribution totals only, skipping the timeline and per-callback trace. Profiles are roughly 95% smaller (several MB down to ~200 KB), making always-on background sampling safe on busy production sites. You still get the full “who owns the time” breakdown; the Timeline and Trace tabs note when a capture was lightweight.
- New: Cron profiling (Settings Profile Cron Jobs) — opt in to sample WP-Cron runs (normally skipped) so the Cron tab shows measured per-hook cost from real runs, with the worst run flagged.
1.1.0
This release focuses on trust — opt-in defaults and honest disclosure — alongside a redesigned timeline and deeper attribution.
- New: Redesigned Request Timeline — a cost-sorted “who owns the time” bar names the culprit at a glance, over a chronological timeline with WordPress lifecycle phase markers. Unattributed time is always shown (never hidden); HTTP waits and database-query density get their own lanes; memory is drawn as a growth curve. Colour-blind-safe (Okabe–Ito) palette, with zoom and pan.
- New: One shared timeline renderer — a profile looks identical in the dashboard and in a shared report, which now also has a dark mode.
- New: Core-developer attribution — the single “core” bucket splits into WordPress subsystems (Query, Options, Blocks, REST, i18n…); deprecations and _doing_it_wrong() notices are captured with the source that triggered them; just-in-time translation loads are surfaced with the hook that caused them; and the pre-plugin bootstrap is split into must-use vs. active-plugin loading.
- New: Accurate outbound-HTTP timing — each call records whether PHP actually waited (blocking) or fired-and-forgot (async), shown distinctly on the timeline, instead of inferring it from duration.
- New: Memory over time — memory is sampled at each lifecycle phase, so the timeline shows an honest growth curve with the peak labelled.
- New: Regression detection — a verdict (Likely regression / Difference observed / Within noise / Insufficient data) from comparing a route against its own history, with a long-term aggregate that survives deploys and the 7-day profile retention. Detection only — it never blocks or changes anything.
- Changed: Early-boot timing is now opt-in — activation no longer writes a must-use plugin; enable it from Settings (or WP-CLI) when you want pre-plugin bootstrap timing.
- Changed: Query profiling (SAVEQUERIES) now defaults off — enable it from Settings when you need per-query detail; the basic query count is always available.
- Changed: Outbound HTTP URLs are reduced to scheme + host (paths and query strings stripped) on write, read, and output, because paths can carry secret tokens.
- Security: Fixed a bypass where a Scrutineer Application Password (scoped to REST with a short expiry) could be used over XML-RPC, skipping both scope and expiry.
- Security: Legacy stored profiles are re-sanitized on read and output, so older rows can’t leak a full outbound URL through a share or export. Also hardened the WP-CLI export, report-sharing, deactivation/uninstall cleanup, and the autoloader.
- Fixed: Shared-report viewer — trace callbacks show their names grouped by hook, the breakdown bar renders correctly, the timeline follows dark mode, and duplicate tabs are removed.
- Accessibility: Full ARIA tab pattern with arrow-key navigation, focus management on view changes, and screen-reader announcements for dynamic content.
- i18n: All dashboard strings are translatable; a fresh translation template (.pot) ships with the plugin.
- Docs: Added an External Services disclosure for the optional report-sharing relay, and corrected readme/agent wording to match the privacy behavior (host-only HTTP, opt-in defaults).
1.0.3
- Security: GDPR-compliant IP hashing — API log stores HMAC-SHA256 pseudonyms, not raw IPs
- Security: Activation tokens bound to issuing admin user ID
- Security: Proxy header spoofing fix (REMOTE_ADDR only by default)
- Security: Query strings stripped from profile URLs at write time
- New: Background profiling filters — user scope (all/anonymous/logged-in) and path exclusions
- New: Proxy trust settings with auto-detection
- New: Full-page settings view replaces settings modal
- Improved: Profile data compressed with gzip (smaller database footprint)
- Improved: Overhead claims updated with real benchmark numbers
- Improved: Settings page polish — card hierarchy, callout notes, layout fixes
- Community: 4 merged PRs from George Stephanis
1.0.2
- Improved: Early boot timer mu-plugin auto-installs on activation — bootstrap timing works without a WP-CLI step
- Improved: Uninstall cleans up the mu-plugin along with all other plugin data
1.0.1
- Fix: handle_prompt AJAX handler now returns proper JSON response
- Fix: API audit log table creation on activation
- Fix: Cron schedule registration runs only once per lifecycle
- Fix: WCAG contrast ratios for muted text and inactive tabs
- Fix: Timeline milestone labels no longer clip at container edges
- Fix: Query density strip zoom alignment
- Fix: Share payload field mapping for viewer compatibility
- Fix: Duplicate sort click handlers on History/Cron tabs
- Improved: Shared reports ledger with revocable links
- Improved: Profile TTL controls (7/14/30 day or never) with countdown badges
- Improved: Pinned and shared profiles exempt from TTL cleanup
- Improved: Queries pill labels are now context-aware
- Improved: Clean uninstall removes all tables, options, cron hooks, and app passwords
1.0.0
- Initial release
- Server request duration profiling with source attribution
- SQL query profiling with tokenizer-based sanitization
- HTTP call tracking
- Autoloaded options analysis
- Enqueued assets inventory
- Hook execution trace with phase grouping
- Timeline visualization with milestone markers
- Route-based grouping with human-readable labels
- Background capture with configurable sample rate
- Pin & annotate with notes and tags
- Profile retention with TTL and per-route cap
- Cron inventory
- REST API (7 endpoints)
- Send to Agent with Application Password credentials
- Send to Support with zero-knowledge encrypted sharing
- WP-CLI integration (8 commands)